29
/
en
AIzaSyAYiBZKx7MnpbEhh9jyipgxe19OcubqV5w
April 1, 2024
164458
Jordan
JOR
true
2
1
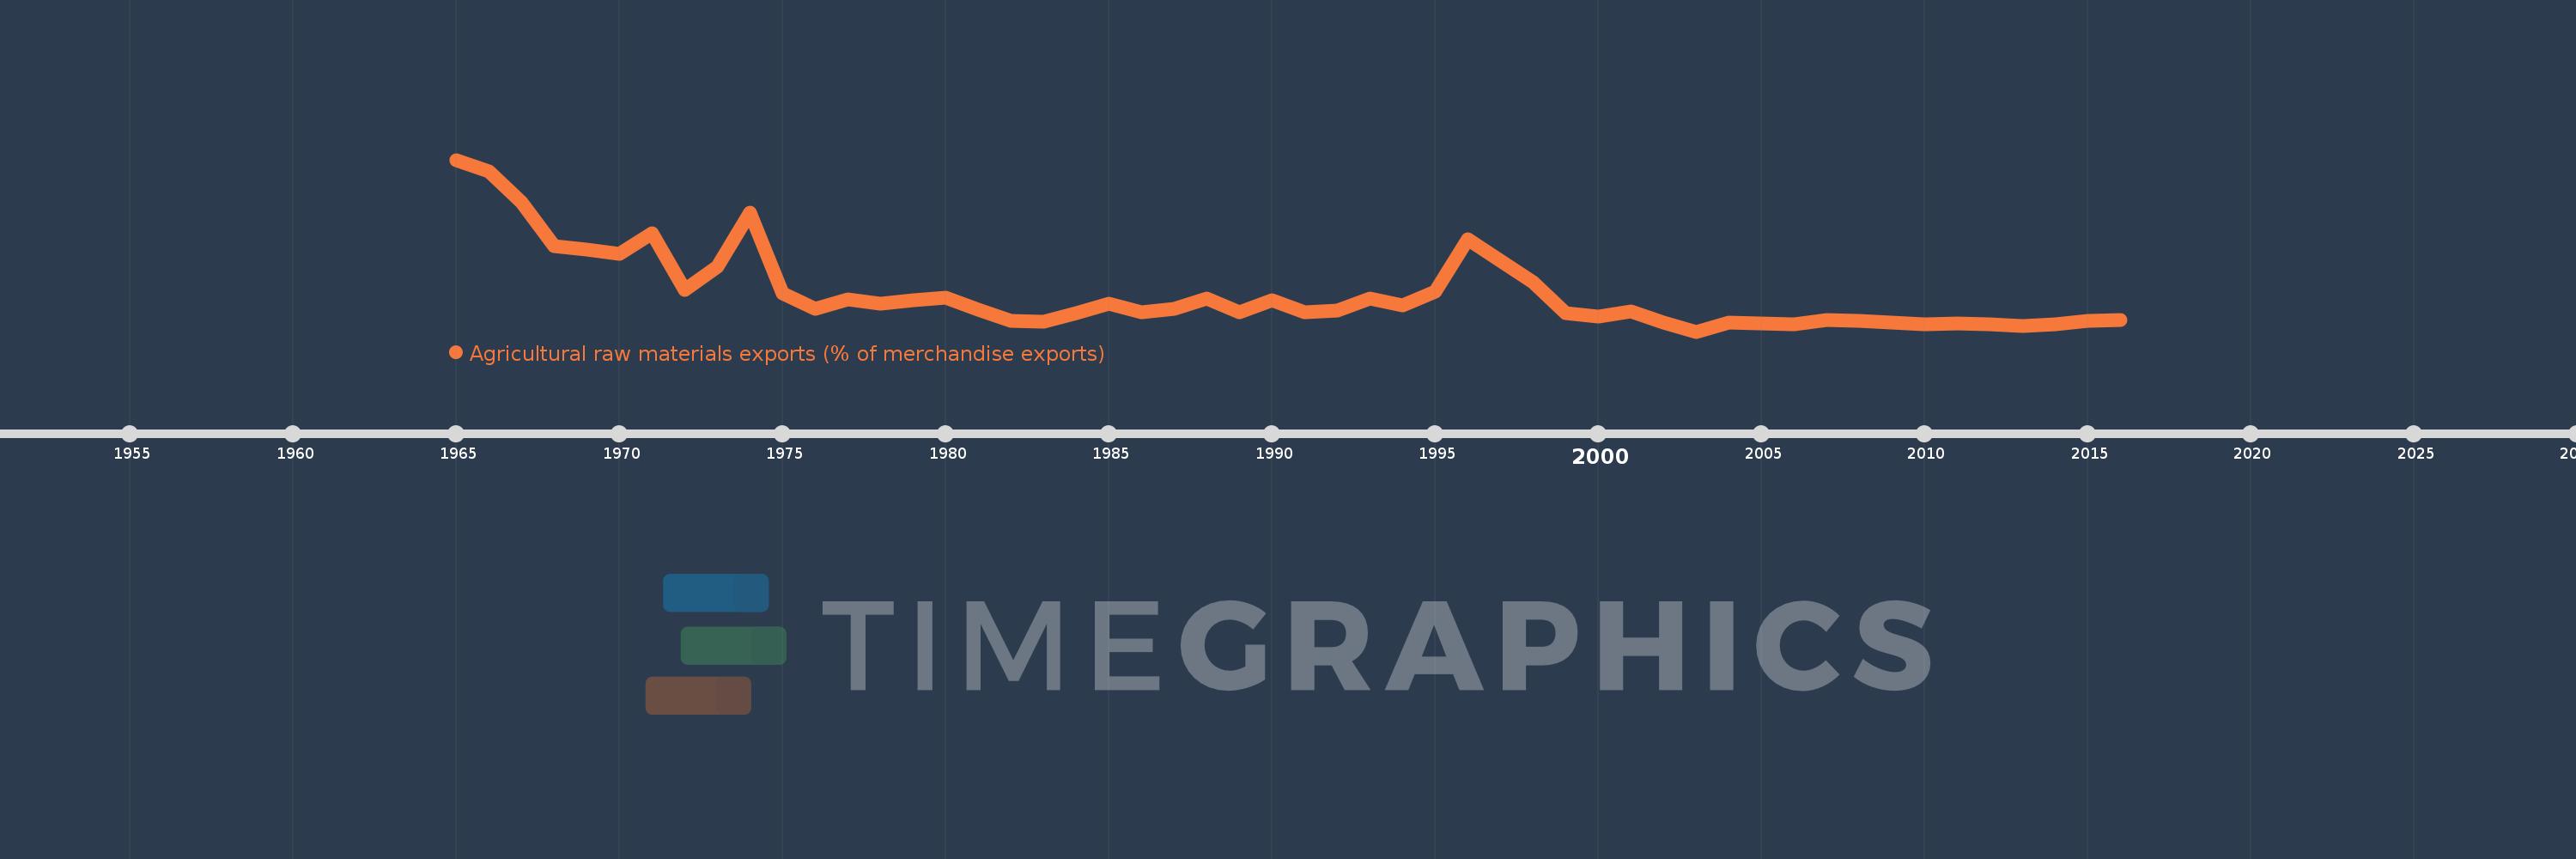
Agricultural raw materials exports (% of merchandise exports)
2016,2015,2014,2013,2012,2011,2010,2009,2008,2007,2006,2005,2004,2003,2002,2001,2000,1999,1998,1996,1995,1994,1993,1992,1991,1990,1989,1988,1987,1986,1985,1984,1983,1982,1981,1980,1979,1978,1977,1976,1975,1974,1973,1972,1971,1970,1969,1968,1967,1966,1965
This statistics in other country:
AfghanistanAlbaniaAlgeriaAndorraAngolaAntigua and BarbudaArab WorldArgentinaArmeniaArubaAustraliaAustriaAzerbaijanBahamas, TheBahrainBangladeshBarbadosBelarusBelgiumBelizeBeninBermudaBhutanBoliviaBosnia and HerzegovinaBotswanaBrazilBrunei DarussalamBulgariaBurkina FasoBurundiCabo VerdeCambodiaCameroonCanadaCaribbean small statesCayman IslandsCentral African RepublicCentral Europe and the BalticsChadChileChinaColombiaComorosCongo, Dem. Rep.Congo, Rep.Costa RicaCote d'IvoireCroatiaCubaCyprusCzech RepublicDenmarkDjiboutiDominicaDominican RepublicEarly-demographic dividendEast Asia & PacificEast Asia & Pacific (excluding high income)East Asia & Pacific (IDA & IBRD countries)EcuadorEgypt, Arab Rep.El SalvadorEquatorial GuineaEritreaEstoniaEthiopiaEuro areaEurope & Central AsiaEurope & Central Asia (excluding high income)Europe & Central Asia (IDA & IBRD countries)European UnionFaroe IslandsFijiFinlandFragile and conflict affected situationsFranceFrench PolynesiaGabonGambia, TheGeorgiaGermanyGhanaGreeceGreenlandGrenadaGuatemalaGuineaGuinea-BissauGuyanaHaitiHeavily indebted poor countries (HIPC)High incomeHondurasHong Kong SAR, ChinaHungaryIBRD onlyIcelandIDA & IBRD totalIDA blendIDA onlyIDA totalIndiaIndonesiaIran, Islamic Rep.IraqIrelandIsraelItalyJamaicaJapanJordanKazakhstanKenyaKiribatiKorea, Rep.KuwaitKyrgyz RepublicLao PDRLate-demographic dividendLatin America & Caribbean Latin America & Caribbean (excluding high income)Latin America & the Caribbean (IDA & IBRD countries)LatviaLeast developed countries: UN classificationLebanonLesothoLiberiaLibyaLithuaniaLow & middle incomeLower middle incomeLuxembourgMacao SAR, ChinaMacedonia, FYRMadagascarMalawiMalaysiaMaldivesMaliMaltaMauritaniaMauritiusMexicoMiddle East & North AfricaMiddle East & North Africa (excluding high income)Middle East & North Africa (IDA & IBRD countries)Middle incomeMoldovaMongoliaMoroccoMozambiqueMyanmarNamibiaNepalNetherlandsNew CaledoniaNew ZealandNicaraguaNigerNigeriaNorth AmericaNorwayOECD membersOmanOther small statesPacific island small statesPakistanPalauPanamaPapua New GuineaParaguayPeruPhilippinesPolandPortugalPost-demographic dividendPre-demographic dividendQatarRomaniaRussian FederationRwandaSamoaSao Tome and PrincipeSaudi ArabiaSenegalSerbiaSeychellesSierra LeoneSingaporeSlovak RepublicSloveniaSmall statesSolomon IslandsSomaliaSouth AfricaSouth AsiaSouth Asia (IDA & IBRD)SpainSri LankaSt. Kitts and NevisSt. LuciaSt. Vincent and the GrenadinesSub-Saharan Africa Sub-Saharan Africa (excluding high income)Sub-Saharan Africa (IDA & IBRD countries)SudanSurinameSwazilandSwedenSwitzerlandSyrian Arab RepublicTajikistanTanzaniaThailandTimor-LesteTogoTongaTrinidad and TobagoTunisiaTurkeyTurkmenistanTurks and Caicos IslandsTuvaluUgandaUkraineUnited Arab EmiratesUnited KingdomUnited StatesUpper middle incomeUruguayVanuatuVenezuela, RBVietnamVirgin Islands (U.S.)WorldYemen, Rep.ZambiaZimbabwe Timeline:
This timeline shows a graph from 1965 to 2016 of Jordan. No data until 1964. Number of actual observations by date: 51.
Source name:
World Development Indicators
Source organization:
World Bank staff estimates from the Comtrade database maintained by the United Nations Statistics Division.
Categories, topics:
Agriculture & Rural Development, Private Sector, Trade
Last updated:
apr 23, 2017
Indicators value changes by year
At the date of observation
Value
Absolute change
Change from previous value
jan 1, 1965
3.557
+3.557
0.0%
jan 1, 1966
3.325
-0.233
-6.54%
jan 1, 1967
2.689
-0.636
-19.12%
jan 1, 1968
1.795
-0.894
-33.23%
jan 1, 1969
1.724
-0.071
-3.97%
jan 1, 1970
1.638
-0.087
-5.03%
jan 1, 1971
2.056
+0.419
25.57%
jan 1, 1972
0.909
-1.147
-55.77%
jan 1, 1973
1.374
+0.464
51.06%
jan 1, 1974
2.473
+1.099
79.99%
jan 1, 1975
0.838
-1.634
-66.09%
jan 1, 1976
0.523
-0.315
-37.59%
jan 1, 1977
0.703
+0.18
34.34%
jan 1, 1978
0.628
-0.075
-10.67%
jan 1, 1979
0.688
+0.06
9.57%
jan 1, 1980
0.748
+0.06
8.69%
jan 1, 1981
0.506
-0.242
-32.32%
jan 1, 1982
0.276
-0.23
-45.46%
jan 1, 1983
0.253
-0.023
-8.33%
jan 1, 1984
0.422
+0.169
66.62%
jan 1, 1985
0.622
+0.2
47.4%
jan 1, 1986
0.455
-0.167
-26.88%
jan 1, 1987
0.523
+0.068
15.0%
jan 1, 1988
0.731
+0.209
39.92%
jan 1, 1989
0.452
-0.279
-38.21%
jan 1, 1990
0.698
+0.246
54.5%
jan 1, 1991
0.445
-0.254
-36.31%
jan 1, 1992
0.476
+0.032
7.15%
jan 1, 1993
0.731
+0.255
53.53%
jan 1, 1994
0.58
-0.152
-20.74%
jan 1, 1995
0.871
+0.291
50.2%
jan 1, 1996
1.937
+1.066
122.37%
jan 1, 1998
1.053
-0.884
-45.64%
jan 1, 1999
0.423
-0.629
-59.79%
jan 1, 2000
0.358
-0.066
-15.52%
jan 1, 2001
0.472
+0.115
32.09%
jan 1, 2002
0.234
-0.239
-50.51%
jan 1, 2003
0.054
-0.18
-77.0%
jan 1, 2004
0.242
+0.189
351.01%
jan 1, 2005
0.216
-0.026
-10.74%
jan 1, 2006
0.207
-0.01
-4.52%
jan 1, 2007
0.284
+0.077
37.42%
jan 1, 2008
0.265
-0.019
-6.75%
jan 1, 2009
0.242
-0.022
-8.47%
jan 1, 2010
0.196
-0.046
-19.18%
jan 1, 2011
0.218
+0.022
11.05%
jan 1, 2012
0.205
-0.013
-5.86%
jan 1, 2013
0.164
-0.04
-19.77%
jan 1, 2014
0.205
+0.041
24.86%
jan 1, 2015
0.279
+0.074
35.84%
jan 1, 2016
0.294
+0.016
5.62%
Ranking of countries by current statistics by years


Comments: