29
/
en
AIzaSyAYiBZKx7MnpbEhh9jyipgxe19OcubqV5w
April 1, 2024
250478
St. Lucia
LCA
true
2
1
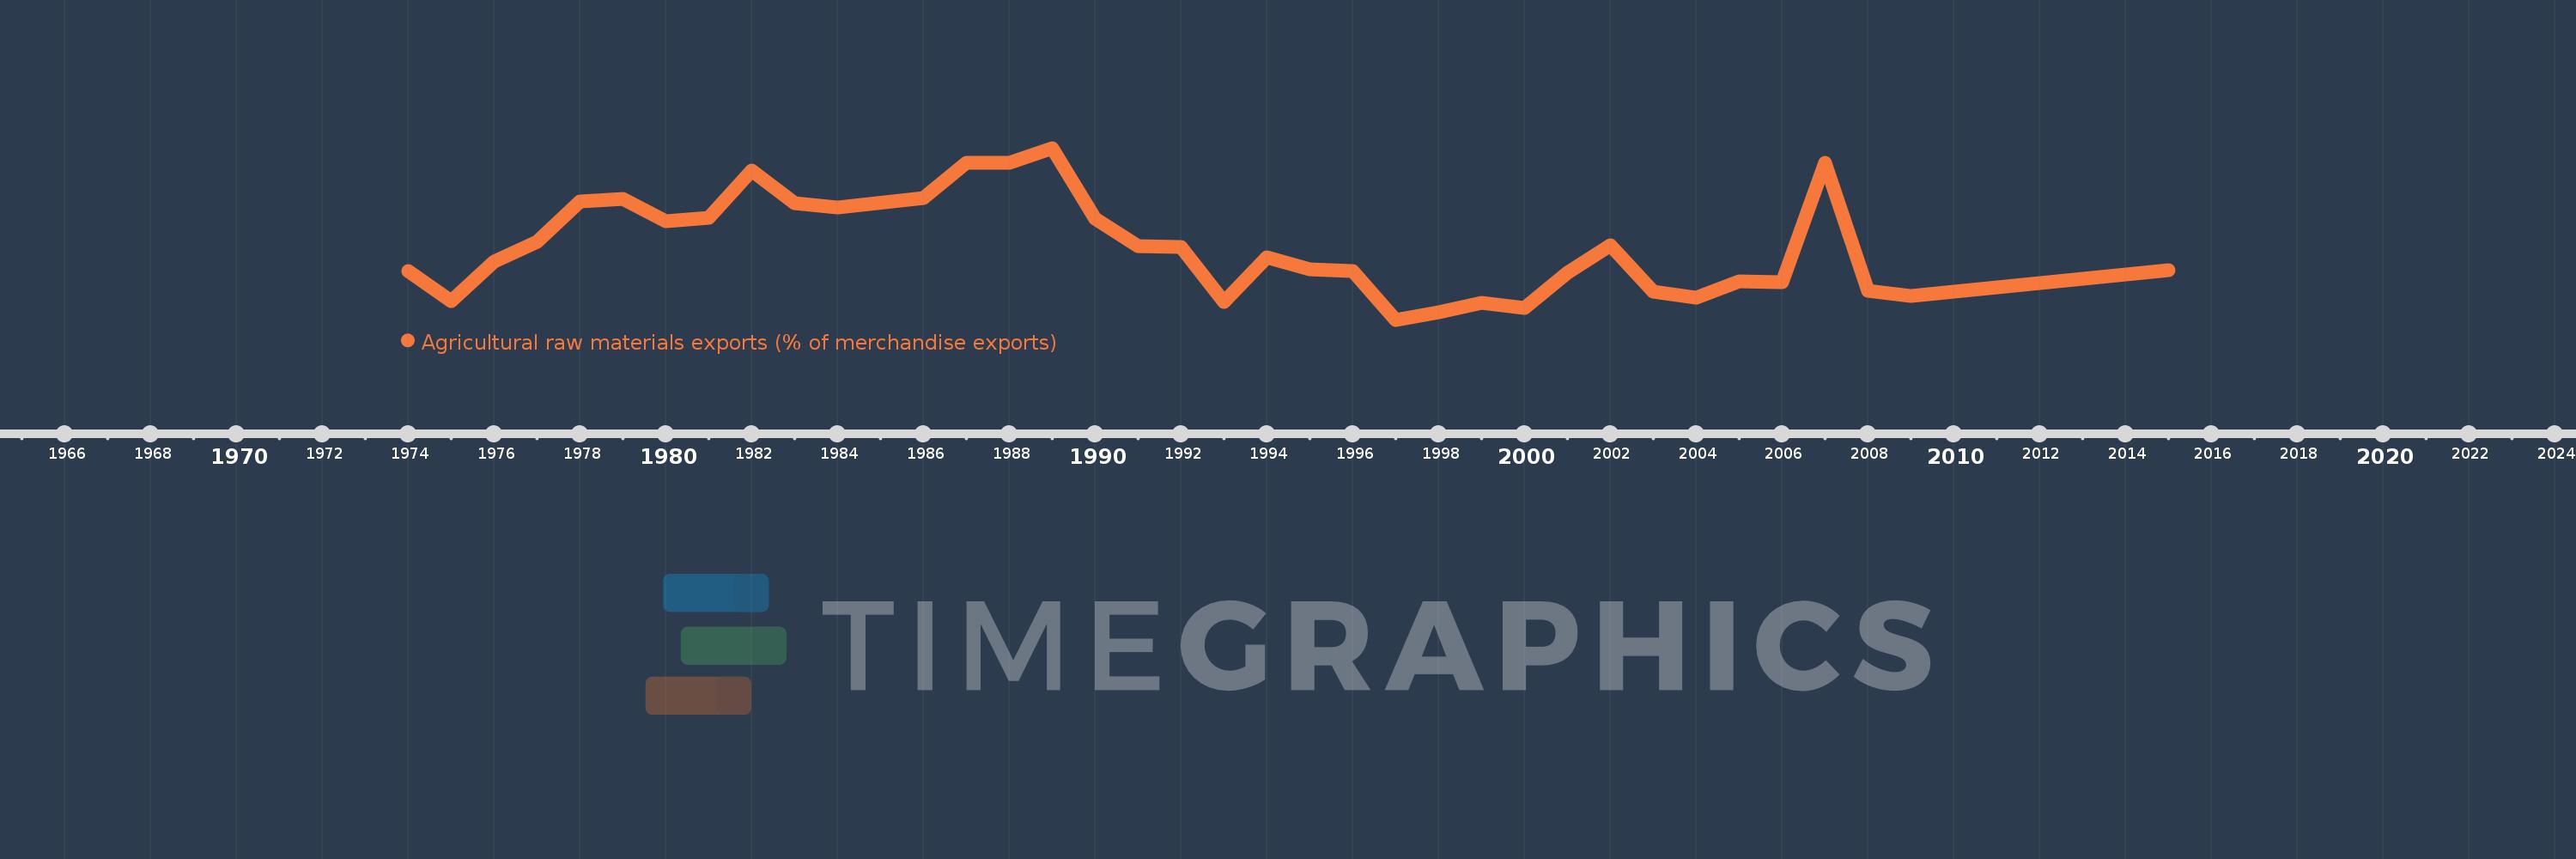
Agricultural raw materials exports (% of merchandise exports)
2015,2009,2008,2007,2006,2005,2004,2003,2002,2001,2000,1999,1998,1997,1996,1995,1994,1993,1992,1991,1990,1989,1988,1987,1986,1984,1983,1982,1981,1980,1979,1978,1977,1976,1975,1974
This statistics in other country:
AfghanistanAlbaniaAlgeriaAndorraAngolaAntigua and BarbudaArab WorldArgentinaArmeniaArubaAustraliaAustriaAzerbaijanBahamas, TheBahrainBangladeshBarbadosBelarusBelgiumBelizeBeninBermudaBhutanBoliviaBosnia and HerzegovinaBotswanaBrazilBrunei DarussalamBulgariaBurkina FasoBurundiCabo VerdeCambodiaCameroonCanadaCaribbean small statesCayman IslandsCentral African RepublicCentral Europe and the BalticsChadChileChinaColombiaComorosCongo, Dem. Rep.Congo, Rep.Costa RicaCote d'IvoireCroatiaCubaCyprusCzech RepublicDenmarkDjiboutiDominicaDominican RepublicEarly-demographic dividendEast Asia & PacificEast Asia & Pacific (excluding high income)East Asia & Pacific (IDA & IBRD countries)EcuadorEgypt, Arab Rep.El SalvadorEquatorial GuineaEritreaEstoniaEthiopiaEuro areaEurope & Central AsiaEurope & Central Asia (excluding high income)Europe & Central Asia (IDA & IBRD countries)European UnionFaroe IslandsFijiFinlandFragile and conflict affected situationsFranceFrench PolynesiaGabonGambia, TheGeorgiaGermanyGhanaGreeceGreenlandGrenadaGuatemalaGuineaGuinea-BissauGuyanaHaitiHeavily indebted poor countries (HIPC)High incomeHondurasHong Kong SAR, ChinaHungaryIBRD onlyIcelandIDA & IBRD totalIDA blendIDA onlyIDA totalIndiaIndonesiaIran, Islamic Rep.IraqIrelandIsraelItalyJamaicaJapanJordanKazakhstanKenyaKiribatiKorea, Rep.KuwaitKyrgyz RepublicLao PDRLate-demographic dividendLatin America & Caribbean Latin America & Caribbean (excluding high income)Latin America & the Caribbean (IDA & IBRD countries)LatviaLeast developed countries: UN classificationLebanonLesothoLiberiaLibyaLithuaniaLow & middle incomeLower middle incomeLuxembourgMacao SAR, ChinaMacedonia, FYRMadagascarMalawiMalaysiaMaldivesMaliMaltaMauritaniaMauritiusMexicoMiddle East & North AfricaMiddle East & North Africa (excluding high income)Middle East & North Africa (IDA & IBRD countries)Middle incomeMoldovaMongoliaMoroccoMozambiqueMyanmarNamibiaNepalNetherlandsNew CaledoniaNew ZealandNicaraguaNigerNigeriaNorth AmericaNorwayOECD membersOmanOther small statesPacific island small statesPakistanPalauPanamaPapua New GuineaParaguayPeruPhilippinesPolandPortugalPost-demographic dividendPre-demographic dividendQatarRomaniaRussian FederationRwandaSamoaSao Tome and PrincipeSaudi ArabiaSenegalSerbiaSeychellesSierra LeoneSingaporeSlovak RepublicSloveniaSmall statesSolomon IslandsSomaliaSouth AfricaSouth AsiaSouth Asia (IDA & IBRD)SpainSri LankaSt. Kitts and NevisSt. LuciaSt. Vincent and the GrenadinesSub-Saharan Africa Sub-Saharan Africa (excluding high income)Sub-Saharan Africa (IDA & IBRD countries)SudanSurinameSwazilandSwedenSwitzerlandSyrian Arab RepublicTajikistanTanzaniaThailandTimor-LesteTogoTongaTrinidad and TobagoTunisiaTurkeyTurkmenistanTurks and Caicos IslandsTuvaluUgandaUkraineUnited Arab EmiratesUnited KingdomUnited StatesUpper middle incomeUruguayVanuatuVenezuela, RBVietnamVirgin Islands (U.S.)WorldYemen, Rep.ZambiaZimbabwe Timeline:
This timeline shows a graph from 1974 to 2015 of St. Lucia. No data until 1973. Number of actual observations by date: 36.
Source name:
World Development Indicators
Source organization:
World Bank staff estimates from the Comtrade database maintained by the United Nations Statistics Division.
Categories, topics:
Agriculture & Rural Development, Private Sector, Trade
Last updated:
apr 23, 2017
Indicators value changes by year
At the date of observation
Value
Absolute change
Change from previous value
jan 1, 1974
0.407
+0.407
0.0%
jan 1, 1975
0.239
-0.168
-41.22%
jan 1, 1976
0.457
+0.218
90.94%
jan 1, 1977
0.568
+0.111
24.21%
jan 1, 1978
0.789
+0.222
39.04%
jan 1, 1979
0.804
+0.014
1.82%
jan 1, 1980
0.681
-0.123
-15.25%
jan 1, 1981
0.698
+0.017
2.43%
jan 1, 1982
0.96
+0.262
37.5%
jan 1, 1983
0.778
-0.181
-18.91%
jan 1, 1984
0.755
-0.023
-2.98%
jan 1, 1986
0.808
+0.053
6.99%
jan 1, 1987
1.001
+0.193
23.9%
jan 1, 1988
0.999
-0.002
-0.16%
jan 1, 1989
1.082
+0.083
8.27%
jan 1, 1990
0.692
-0.39
-36.07%
jan 1, 1991
0.543
-0.148
-21.46%
jan 1, 1992
0.538
-0.005
-0.93%
jan 1, 1993
0.238
-0.3
-55.71%
jan 1, 1994
0.48
+0.242
101.57%
jan 1, 1995
0.413
-0.068
-14.1%
jan 1, 1996
0.405
-0.008
-1.94%
jan 1, 1997
0.138
-0.267
-65.96%
jan 1, 1998
0.177
+0.039
28.32%
jan 1, 1999
0.233
+0.057
32.04%
jan 1, 2000
0.205
-0.029
-12.28%
jan 1, 2001
0.398
+0.194
94.62%
jan 1, 2002
0.548
+0.149
37.51%
jan 1, 2003
0.291
-0.257
-46.94%
jan 1, 2004
0.261
-0.03
-10.15%
jan 1, 2005
0.351
+0.09
34.54%
jan 1, 2006
0.343
-0.009
-2.53%
jan 1, 2007
0.999
+0.657
191.74%
jan 1, 2008
0.297
-0.702
-70.25%
jan 1, 2009
0.268
-0.03
-9.99%
jan 1, 2015
0.411
+0.143
53.61%
Ranking of countries by current statistics by years


Comments: