29
/
en
AIzaSyAYiBZKx7MnpbEhh9jyipgxe19OcubqV5w
April 1, 2024
225603
Portugal
PRT
true
2
1
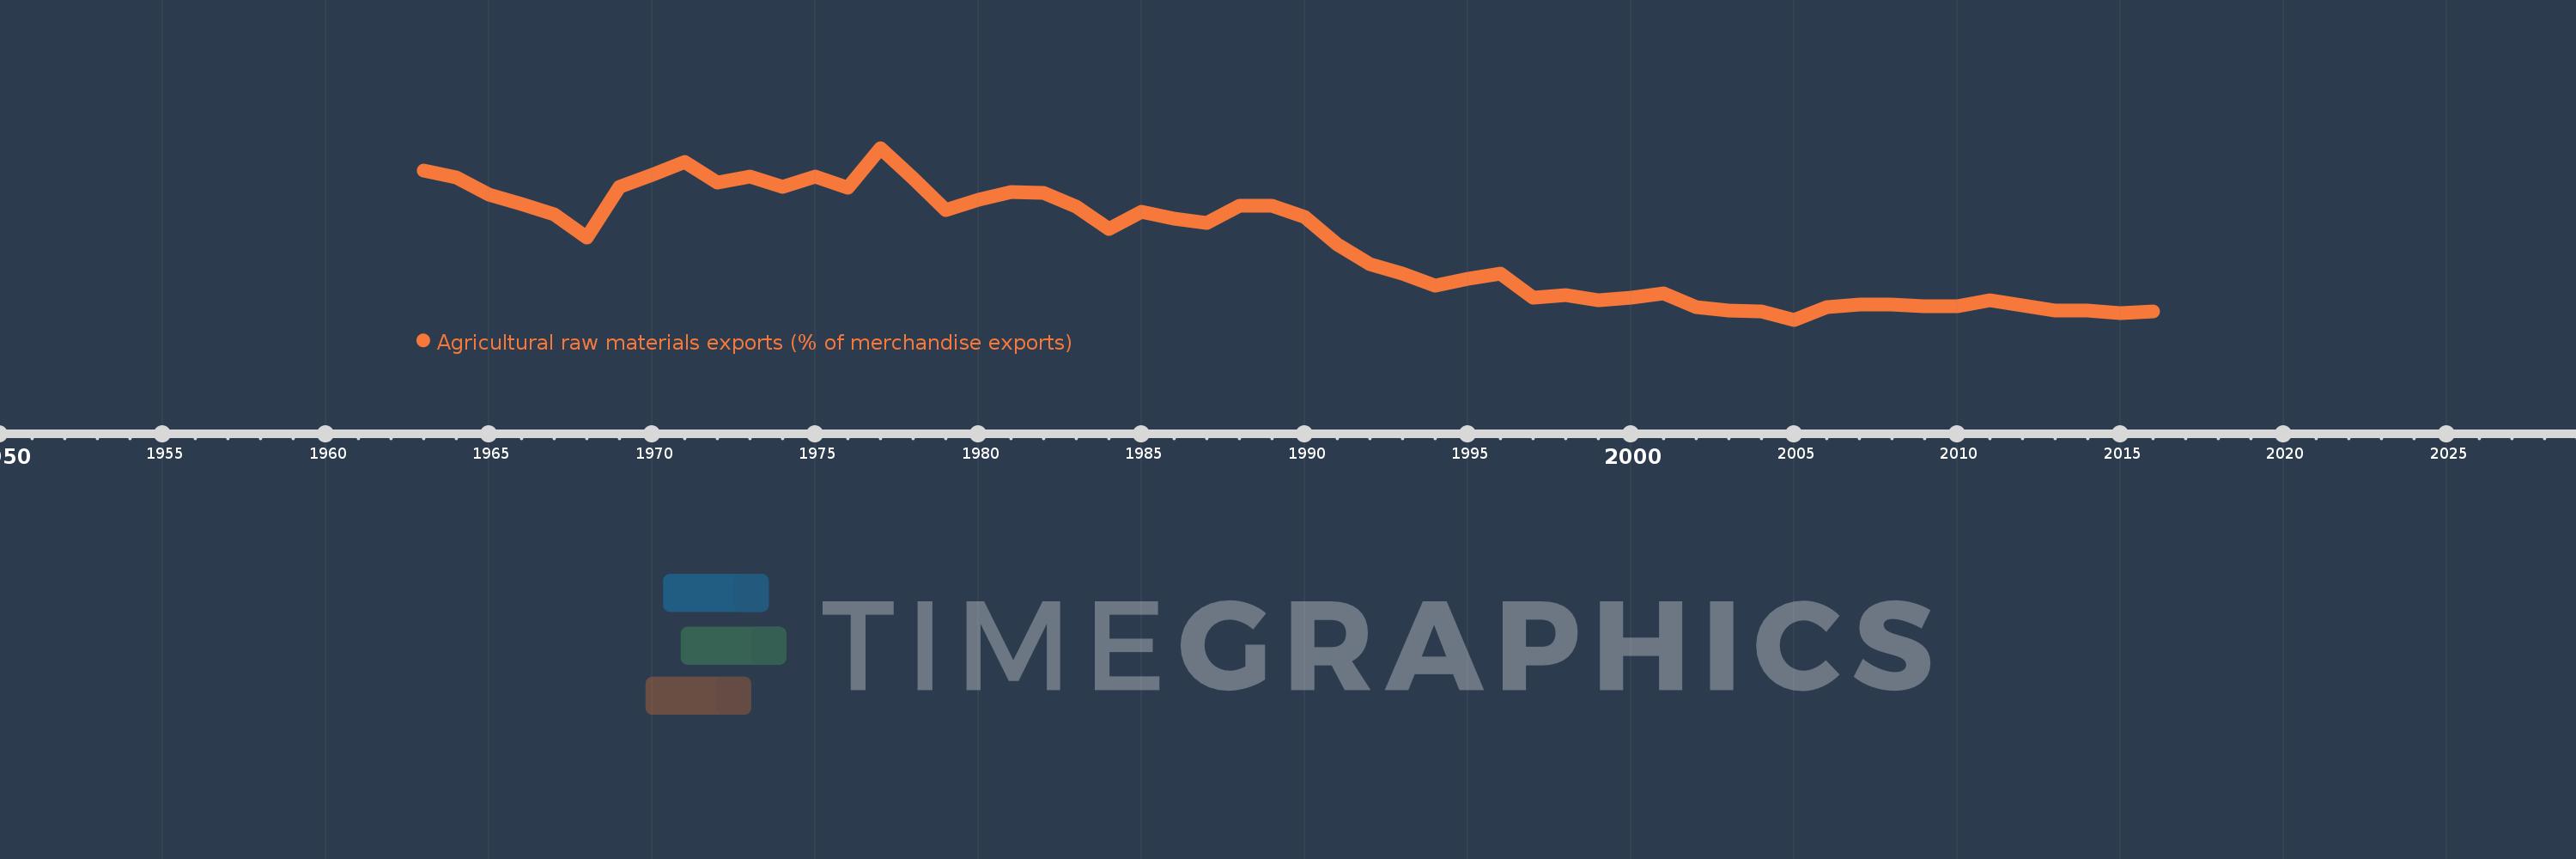
Agricultural raw materials exports (% of merchandise exports)
2016,2015,2014,2013,2012,2011,2010,2009,2008,2007,2006,2005,2004,2003,2002,2001,2000,1999,1998,1997,1996,1995,1994,1993,1992,1991,1990,1989,1988,1987,1986,1985,1984,1983,1982,1981,1980,1979,1978,1977,1976,1975,1974,1973,1972,1971,1970,1969,1968,1967,1966,1965,1964,1963
This statistics in other country:
AfghanistanAlbaniaAlgeriaAndorraAngolaAntigua and BarbudaArab WorldArgentinaArmeniaArubaAustraliaAustriaAzerbaijanBahamas, TheBahrainBangladeshBarbadosBelarusBelgiumBelizeBeninBermudaBhutanBoliviaBosnia and HerzegovinaBotswanaBrazilBrunei DarussalamBulgariaBurkina FasoBurundiCabo VerdeCambodiaCameroonCanadaCaribbean small statesCayman IslandsCentral African RepublicCentral Europe and the BalticsChadChileChinaColombiaComorosCongo, Dem. Rep.Congo, Rep.Costa RicaCote d'IvoireCroatiaCubaCyprusCzech RepublicDenmarkDjiboutiDominicaDominican RepublicEarly-demographic dividendEast Asia & PacificEast Asia & Pacific (excluding high income)East Asia & Pacific (IDA & IBRD countries)EcuadorEgypt, Arab Rep.El SalvadorEquatorial GuineaEritreaEstoniaEthiopiaEuro areaEurope & Central AsiaEurope & Central Asia (excluding high income)Europe & Central Asia (IDA & IBRD countries)European UnionFaroe IslandsFijiFinlandFragile and conflict affected situationsFranceFrench PolynesiaGabonGambia, TheGeorgiaGermanyGhanaGreeceGreenlandGrenadaGuatemalaGuineaGuinea-BissauGuyanaHaitiHeavily indebted poor countries (HIPC)High incomeHondurasHong Kong SAR, ChinaHungaryIBRD onlyIcelandIDA & IBRD totalIDA blendIDA onlyIDA totalIndiaIndonesiaIran, Islamic Rep.IraqIrelandIsraelItalyJamaicaJapanJordanKazakhstanKenyaKiribatiKorea, Rep.KuwaitKyrgyz RepublicLao PDRLate-demographic dividendLatin America & Caribbean Latin America & Caribbean (excluding high income)Latin America & the Caribbean (IDA & IBRD countries)LatviaLeast developed countries: UN classificationLebanonLesothoLiberiaLibyaLithuaniaLow & middle incomeLower middle incomeLuxembourgMacao SAR, ChinaMacedonia, FYRMadagascarMalawiMalaysiaMaldivesMaliMaltaMauritaniaMauritiusMexicoMiddle East & North AfricaMiddle East & North Africa (excluding high income)Middle East & North Africa (IDA & IBRD countries)Middle incomeMoldovaMongoliaMoroccoMozambiqueMyanmarNamibiaNepalNetherlandsNew CaledoniaNew ZealandNicaraguaNigerNigeriaNorth AmericaNorwayOECD membersOmanOther small statesPacific island small statesPakistanPalauPanamaPapua New GuineaParaguayPeruPhilippinesPolandPortugalPost-demographic dividendPre-demographic dividendQatarRomaniaRussian FederationRwandaSamoaSao Tome and PrincipeSaudi ArabiaSenegalSerbiaSeychellesSierra LeoneSingaporeSlovak RepublicSloveniaSmall statesSolomon IslandsSomaliaSouth AfricaSouth AsiaSouth Asia (IDA & IBRD)SpainSri LankaSt. Kitts and NevisSt. LuciaSt. Vincent and the GrenadinesSub-Saharan Africa Sub-Saharan Africa (excluding high income)Sub-Saharan Africa (IDA & IBRD countries)SudanSurinameSwazilandSwedenSwitzerlandSyrian Arab RepublicTajikistanTanzaniaThailandTimor-LesteTogoTongaTrinidad and TobagoTunisiaTurkeyTurkmenistanTurks and Caicos IslandsTuvaluUgandaUkraineUnited Arab EmiratesUnited KingdomUnited StatesUpper middle incomeUruguayVanuatuVenezuela, RBVietnamVirgin Islands (U.S.)WorldYemen, Rep.ZambiaZimbabwe Timeline:
This timeline shows a graph from 1963 to 2016 of Portugal. No data until 1962. Number of actual observations by date: 54.
Source name:
World Development Indicators
Source organization:
World Bank staff estimates from the Comtrade database maintained by the United Nations Statistics Division.
Categories, topics:
Agriculture & Rural Development, Private Sector, Trade
Last updated:
apr 23, 2017
Indicators value changes by year
Maximum:
11.767
jan 1, 1977
At the date of observation
Value
Absolute change
Change from previous value
jan 1, 1963
10.478
+10.478
0.0%
jan 1, 1964
10.102
-0.376
-3.59%
jan 1, 1965
9.099
-1.003
-9.93%
jan 1, 1966
8.563
-0.537
-5.9%
jan 1, 1967
7.966
-0.597
-6.97%
jan 1, 1968
6.673
-1.293
-16.24%
jan 1, 1969
9.536
+2.863
42.91%
jan 1, 1970
10.243
+0.707
7.41%
jan 1, 1971
10.962
+0.719
7.02%
jan 1, 1972
9.806
-1.155
-10.54%
jan 1, 1973
10.117
+0.311
3.17%
jan 1, 1974
9.533
-0.584
-5.77%
jan 1, 1975
10.121
+0.588
6.17%
jan 1, 1976
9.494
-0.627
-6.2%
jan 1, 1977
11.767
+2.273
23.94%
jan 1, 1978
10.047
-1.719
-14.61%
jan 1, 1979
8.216
-1.831
-18.22%
jan 1, 1980
8.815
+0.599
7.29%
jan 1, 1981
9.258
+0.443
5.02%
jan 1, 1982
9.233
-0.025
-0.27%
jan 1, 1983
8.42
-0.813
-8.81%
jan 1, 1984
7.168
-1.252
-14.87%
jan 1, 1985
8.135
+0.967
13.49%
jan 1, 1986
7.756
-0.379
-4.66%
jan 1, 1987
7.497
-0.259
-3.34%
jan 1, 1988
8.482
+0.985
13.14%
jan 1, 1989
8.475
-0.008
-0.09%
jan 1, 1990
7.845
-0.629
-7.43%
jan 1, 1991
6.285
-1.56
-19.88%
jan 1, 1992
5.155
-1.13
-17.98%
jan 1, 1993
4.622
-0.534
-10.36%
jan 1, 1994
3.95
-0.671
-14.53%
jan 1, 1995
4.321
+0.371
9.39%
jan 1, 1996
4.63
+0.309
7.15%
jan 1, 1997
3.264
-1.366
-29.51%
jan 1, 1998
3.397
+0.133
4.08%
jan 1, 1999
3.095
-0.302
-8.88%
jan 1, 2000
3.231
+0.136
4.39%
jan 1, 2001
3.477
+0.246
7.62%
jan 1, 2002
2.706
-0.771
-22.17%
jan 1, 2003
2.517
-0.189
-6.98%
jan 1, 2004
2.452
-0.065
-2.58%
jan 1, 2005
1.995
-0.457
-18.63%
jan 1, 2006
2.714
+0.719
36.02%
jan 1, 2007
2.855
+0.141
5.19%
jan 1, 2008
2.844
-0.011
-0.38%
jan 1, 2009
2.744
-0.1
-3.52%
jan 1, 2010
2.785
+0.041
1.48%
jan 1, 2011
3.107
+0.322
11.56%
jan 1, 2012
2.789
-0.318
-10.22%
jan 1, 2013
2.542
-0.247
-8.85%
jan 1, 2014
2.537
-0.005
-0.2%
jan 1, 2015
2.362
-0.175
-6.91%
jan 1, 2016
2.447
+0.085
3.62%
Ranking of countries by current statistics by years


Comments: