29
/
en
AIzaSyAYiBZKx7MnpbEhh9jyipgxe19OcubqV5w
April 1, 2024
248303
Sri Lanka
LKA
true
2
1
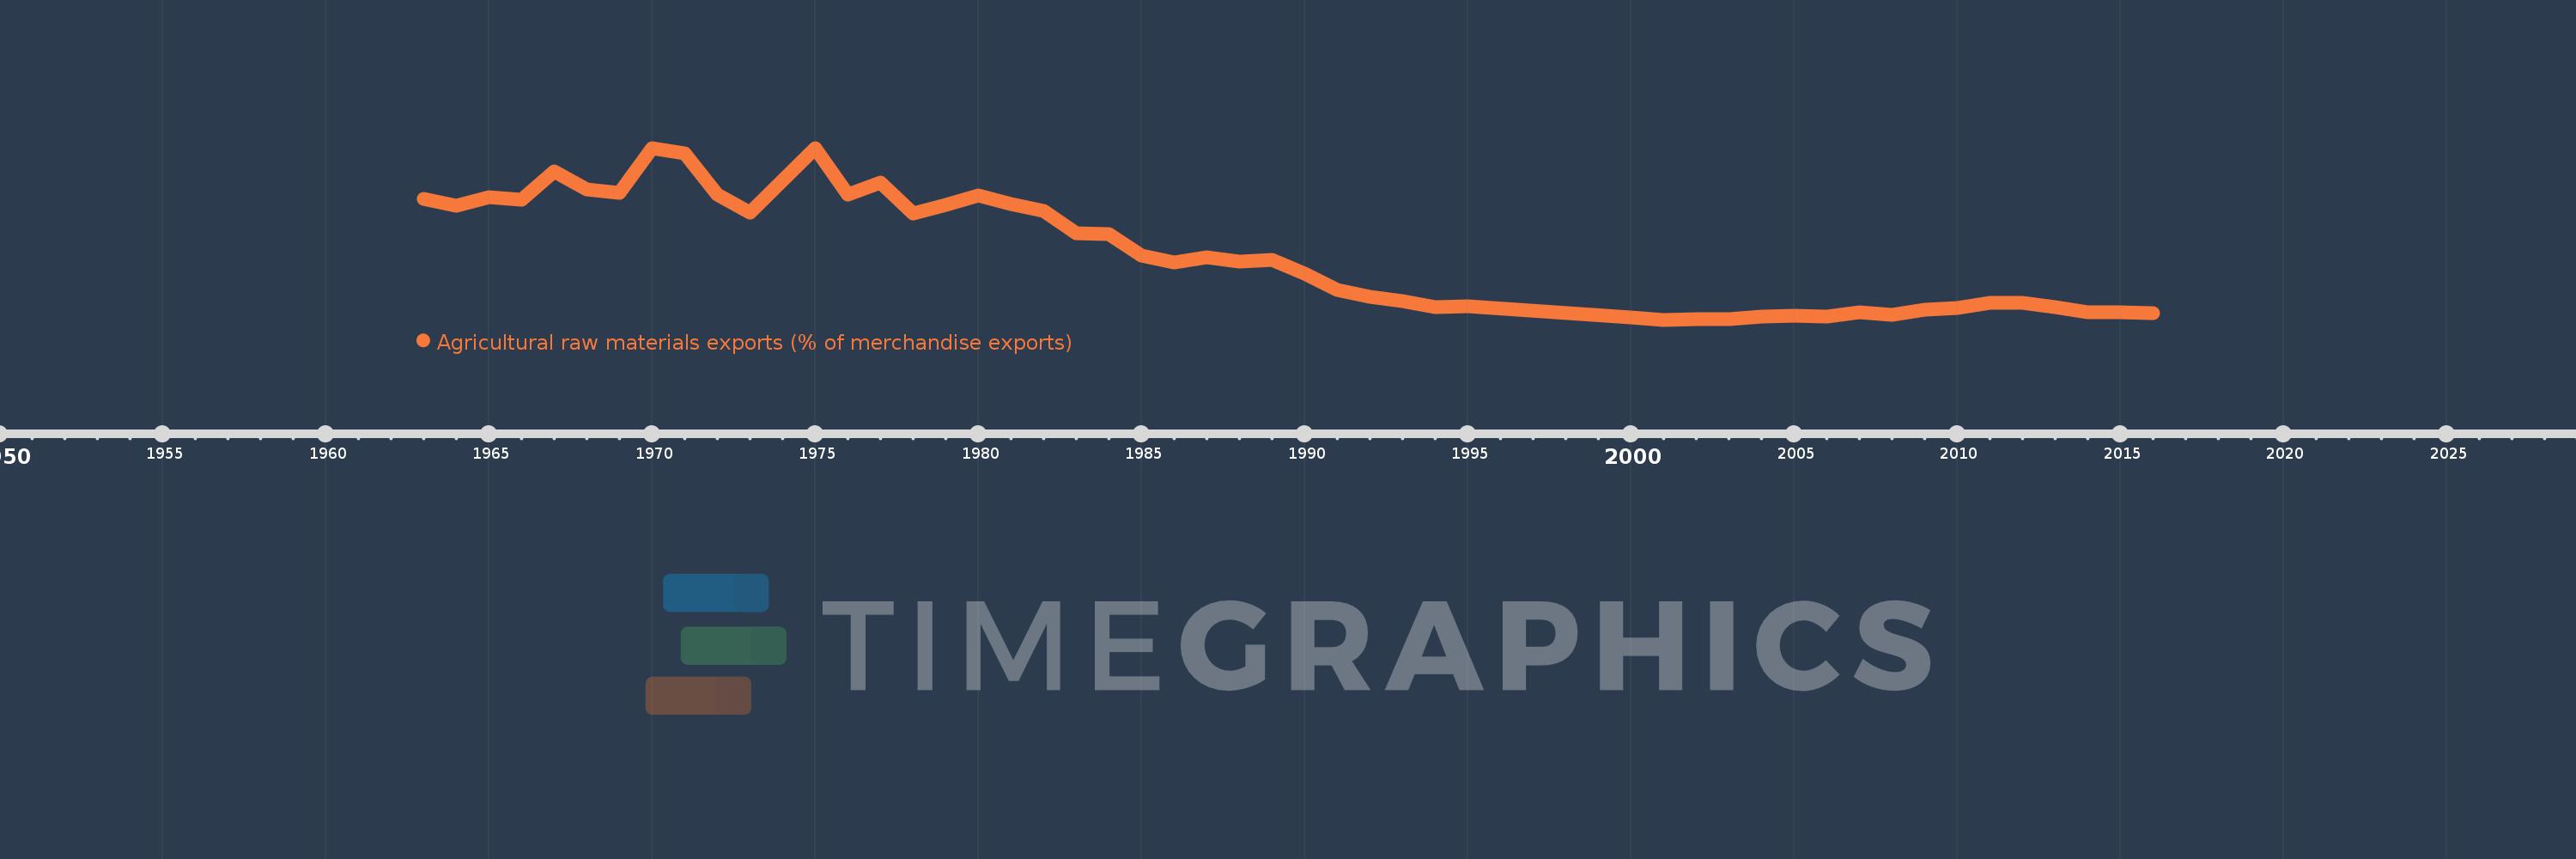
Agricultural raw materials exports (% of merchandise exports)
2016,2015,2014,2013,2012,2011,2010,2009,2008,2007,2006,2005,2004,2003,2002,2001,2000,1995,1994,1993,1992,1991,1990,1989,1988,1987,1986,1985,1984,1983,1982,1981,1980,1979,1978,1977,1976,1975,1973,1972,1971,1970,1969,1968,1967,1966,1965,1964,1963
This statistics in other country:
AfghanistanAlbaniaAlgeriaAndorraAngolaAntigua and BarbudaArab WorldArgentinaArmeniaArubaAustraliaAustriaAzerbaijanBahamas, TheBahrainBangladeshBarbadosBelarusBelgiumBelizeBeninBermudaBhutanBoliviaBosnia and HerzegovinaBotswanaBrazilBrunei DarussalamBulgariaBurkina FasoBurundiCabo VerdeCambodiaCameroonCanadaCaribbean small statesCayman IslandsCentral African RepublicCentral Europe and the BalticsChadChileChinaColombiaComorosCongo, Dem. Rep.Congo, Rep.Costa RicaCote d'IvoireCroatiaCubaCyprusCzech RepublicDenmarkDjiboutiDominicaDominican RepublicEarly-demographic dividendEast Asia & PacificEast Asia & Pacific (excluding high income)East Asia & Pacific (IDA & IBRD countries)EcuadorEgypt, Arab Rep.El SalvadorEquatorial GuineaEritreaEstoniaEthiopiaEuro areaEurope & Central AsiaEurope & Central Asia (excluding high income)Europe & Central Asia (IDA & IBRD countries)European UnionFaroe IslandsFijiFinlandFragile and conflict affected situationsFranceFrench PolynesiaGabonGambia, TheGeorgiaGermanyGhanaGreeceGreenlandGrenadaGuatemalaGuineaGuinea-BissauGuyanaHaitiHeavily indebted poor countries (HIPC)High incomeHondurasHong Kong SAR, ChinaHungaryIBRD onlyIcelandIDA & IBRD totalIDA blendIDA onlyIDA totalIndiaIndonesiaIran, Islamic Rep.IraqIrelandIsraelItalyJamaicaJapanJordanKazakhstanKenyaKiribatiKorea, Rep.KuwaitKyrgyz RepublicLao PDRLate-demographic dividendLatin America & Caribbean Latin America & Caribbean (excluding high income)Latin America & the Caribbean (IDA & IBRD countries)LatviaLeast developed countries: UN classificationLebanonLesothoLiberiaLibyaLithuaniaLow & middle incomeLower middle incomeLuxembourgMacao SAR, ChinaMacedonia, FYRMadagascarMalawiMalaysiaMaldivesMaliMaltaMauritaniaMauritiusMexicoMiddle East & North AfricaMiddle East & North Africa (excluding high income)Middle East & North Africa (IDA & IBRD countries)Middle incomeMoldovaMongoliaMoroccoMozambiqueMyanmarNamibiaNepalNetherlandsNew CaledoniaNew ZealandNicaraguaNigerNigeriaNorth AmericaNorwayOECD membersOmanOther small statesPacific island small statesPakistanPalauPanamaPapua New GuineaParaguayPeruPhilippinesPolandPortugalPost-demographic dividendPre-demographic dividendQatarRomaniaRussian FederationRwandaSamoaSao Tome and PrincipeSaudi ArabiaSenegalSerbiaSeychellesSierra LeoneSingaporeSlovak RepublicSloveniaSmall statesSolomon IslandsSomaliaSouth AfricaSouth AsiaSouth Asia (IDA & IBRD)SpainSri LankaSt. Kitts and NevisSt. LuciaSt. Vincent and the GrenadinesSub-Saharan Africa Sub-Saharan Africa (excluding high income)Sub-Saharan Africa (IDA & IBRD countries)SudanSurinameSwazilandSwedenSwitzerlandSyrian Arab RepublicTajikistanTanzaniaThailandTimor-LesteTogoTongaTrinidad and TobagoTunisiaTurkeyTurkmenistanTurks and Caicos IslandsTuvaluUgandaUkraineUnited Arab EmiratesUnited KingdomUnited StatesUpper middle incomeUruguayVanuatuVenezuela, RBVietnamVirgin Islands (U.S.)WorldYemen, Rep.ZambiaZimbabwe Timeline:
This timeline shows a graph from 1963 to 2016 of Sri Lanka. No data until 1962. Number of actual observations by date: 49.
Source name:
World Development Indicators
Source organization:
World Bank staff estimates from the Comtrade database maintained by the United Nations Statistics Division.
Categories, topics:
Agriculture & Rural Development, Private Sector, Trade
Last updated:
apr 23, 2017
Indicators value changes by year
Maximum:
26.113
jan 1, 1975
At the date of observation
Value
Absolute change
Change from previous value
jan 1, 1963
18.888
+18.888
0.0%
jan 1, 1964
17.803
-1.085
-5.74%
jan 1, 1965
19.13
+1.326
7.45%
jan 1, 1966
18.755
-0.375
-1.96%
jan 1, 1967
22.745
+3.991
21.28%
jan 1, 1968
20.197
-2.548
-11.2%
jan 1, 1969
19.707
-0.491
-2.43%
jan 1, 1970
26.019
+6.312
32.03%
jan 1, 1971
25.281
-0.737
-2.83%
jan 1, 1972
19.505
-5.776
-22.85%
jan 1, 1973
16.847
-2.658
-13.63%
jan 1, 1975
26.113
+9.267
55.01%
jan 1, 1976
19.508
-6.605
-25.29%
jan 1, 1977
21.201
+1.693
8.68%
jan 1, 1978
16.779
-4.422
-20.86%
jan 1, 1979
17.975
+1.196
7.13%
jan 1, 1980
19.388
+1.413
7.86%
jan 1, 1981
18.133
-1.255
-6.47%
jan 1, 1982
17.136
-0.997
-5.5%
jan 1, 1983
13.898
-3.238
-18.89%
jan 1, 1984
13.803
-0.095
-0.69%
jan 1, 1985
10.779
-3.025
-21.91%
jan 1, 1986
9.777
-1.001
-9.29%
jan 1, 1987
10.466
+0.689
7.04%
jan 1, 1988
9.922
-0.544
-5.2%
jan 1, 1989
10.107
+0.185
1.86%
jan 1, 1990
8.117
-1.99
-19.69%
jan 1, 1991
5.813
-2.304
-28.38%
jan 1, 1992
4.9
-0.913
-15.71%
jan 1, 1993
4.191
-0.709
-14.47%
jan 1, 1994
3.425
-0.766
-18.27%
jan 1, 1995
3.52
+0.095
2.76%
jan 1, 2000
1.953
-1.566
-44.51%
jan 1, 2001
1.576
-0.377
-19.3%
jan 1, 2002
1.602
+0.026
1.66%
jan 1, 2003
1.666
+0.064
3.97%
jan 1, 2004
2.046
+0.38
22.81%
jan 1, 2005
2.202
+0.156
7.61%
jan 1, 2006
2.051
-0.151
-6.86%
jan 1, 2007
2.669
+0.619
30.18%
jan 1, 2008
2.289
-0.38
-14.25%
jan 1, 2009
3.07
+0.781
34.11%
jan 1, 2010
3.234
+0.164
5.35%
jan 1, 2011
3.948
+0.714
22.07%
jan 1, 2012
4.023
+0.075
1.89%
jan 1, 2013
3.331
-0.692
-17.21%
jan 1, 2014
2.63
-0.701
-21.03%
jan 1, 2015
2.637
+0.007
0.26%
jan 1, 2016
2.482
-0.155
-5.88%
Ranking of countries by current statistics by years


Comments: