29
/
en
AIzaSyAYiBZKx7MnpbEhh9jyipgxe19OcubqV5w
April 1, 2024
169626
Korea, Rep.
KOR
true
2
1
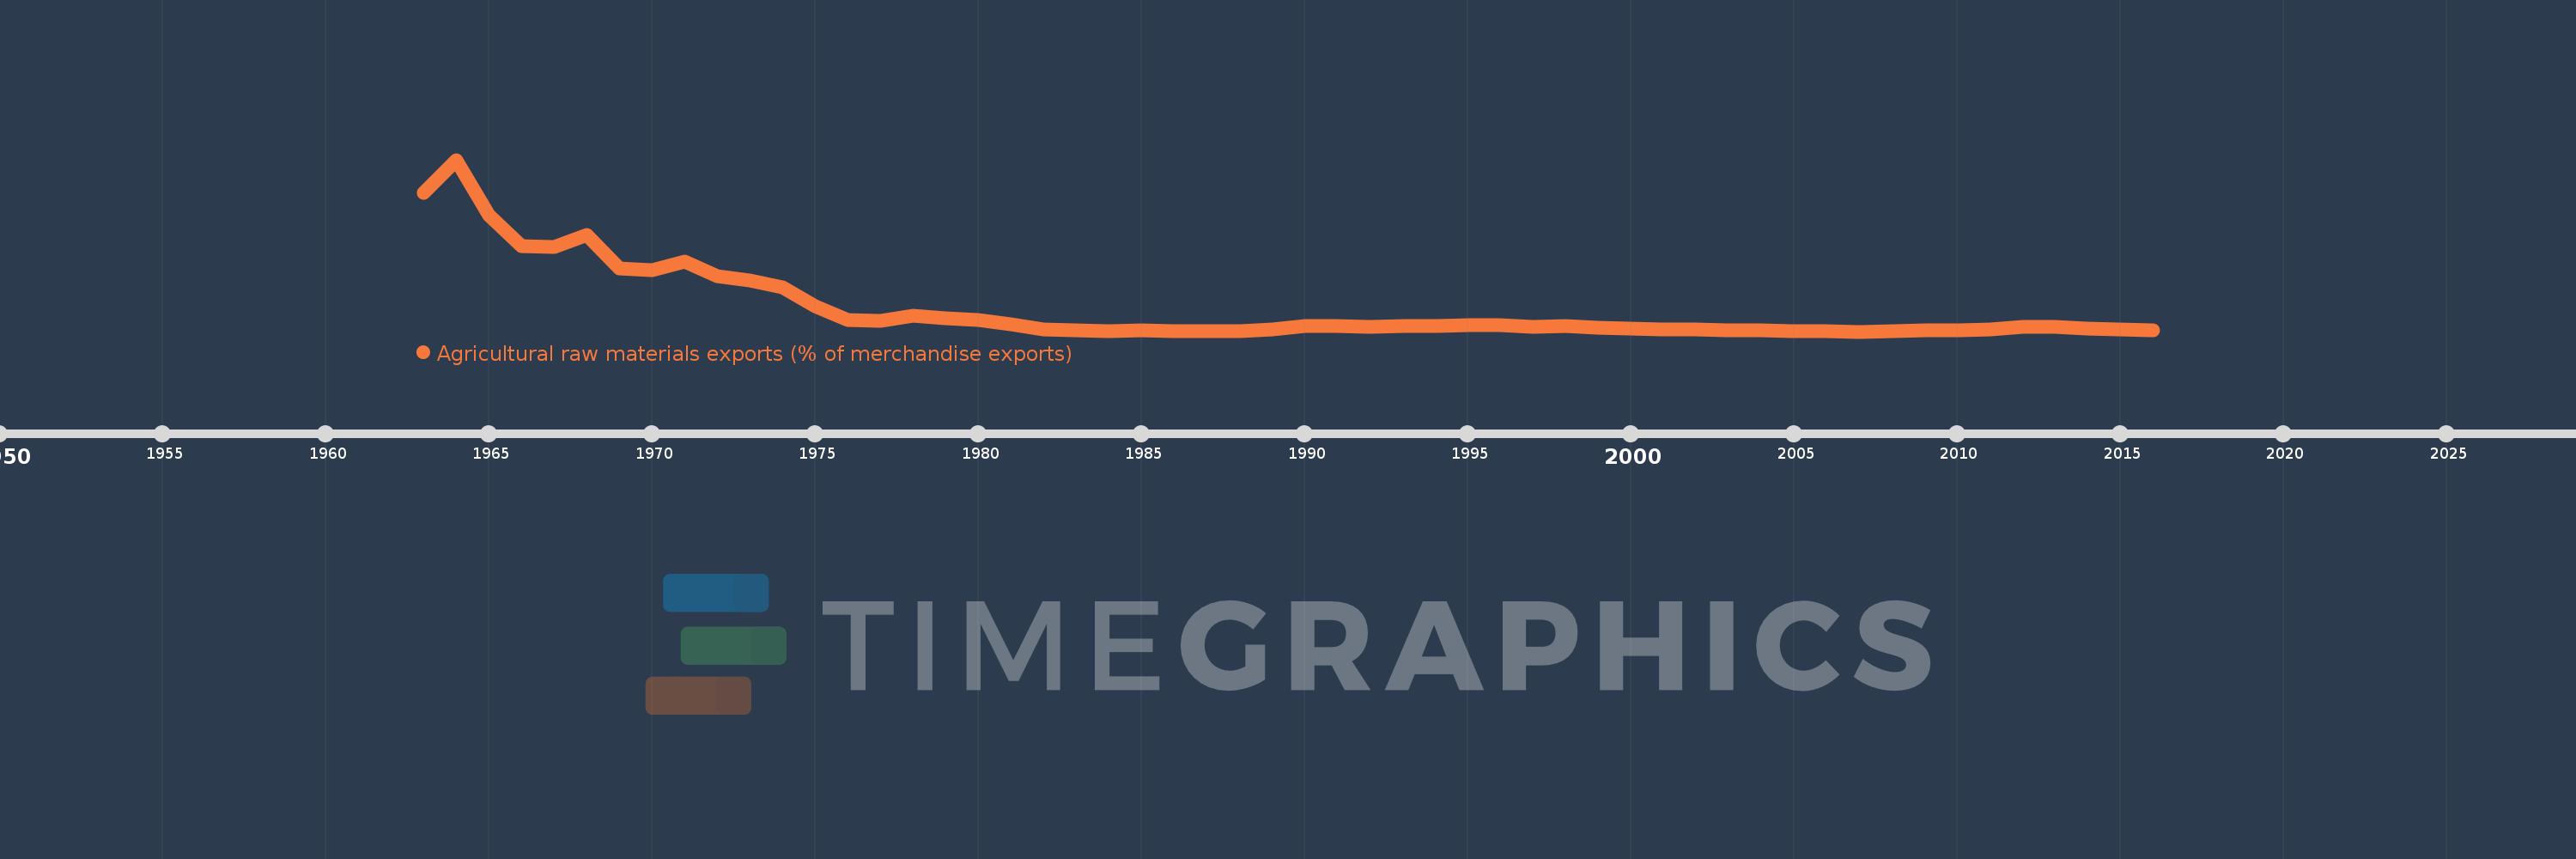
Agricultural raw materials exports (% of merchandise exports)
2016,2015,2014,2013,2012,2011,2010,2009,2008,2007,2006,2005,2004,2003,2002,2001,2000,1999,1998,1997,1996,1995,1994,1993,1992,1991,1990,1989,1988,1987,1986,1985,1984,1983,1982,1981,1980,1979,1978,1977,1976,1975,1974,1973,1972,1971,1970,1969,1968,1967,1966,1965,1964,1963
This statistics in other country:
AfghanistanAlbaniaAlgeriaAndorraAngolaAntigua and BarbudaArab WorldArgentinaArmeniaArubaAustraliaAustriaAzerbaijanBahamas, TheBahrainBangladeshBarbadosBelarusBelgiumBelizeBeninBermudaBhutanBoliviaBosnia and HerzegovinaBotswanaBrazilBrunei DarussalamBulgariaBurkina FasoBurundiCabo VerdeCambodiaCameroonCanadaCaribbean small statesCayman IslandsCentral African RepublicCentral Europe and the BalticsChadChileChinaColombiaComorosCongo, Dem. Rep.Congo, Rep.Costa RicaCote d'IvoireCroatiaCubaCyprusCzech RepublicDenmarkDjiboutiDominicaDominican RepublicEarly-demographic dividendEast Asia & PacificEast Asia & Pacific (excluding high income)East Asia & Pacific (IDA & IBRD countries)EcuadorEgypt, Arab Rep.El SalvadorEquatorial GuineaEritreaEstoniaEthiopiaEuro areaEurope & Central AsiaEurope & Central Asia (excluding high income)Europe & Central Asia (IDA & IBRD countries)European UnionFaroe IslandsFijiFinlandFragile and conflict affected situationsFranceFrench PolynesiaGabonGambia, TheGeorgiaGermanyGhanaGreeceGreenlandGrenadaGuatemalaGuineaGuinea-BissauGuyanaHaitiHeavily indebted poor countries (HIPC)High incomeHondurasHong Kong SAR, ChinaHungaryIBRD onlyIcelandIDA & IBRD totalIDA blendIDA onlyIDA totalIndiaIndonesiaIran, Islamic Rep.IraqIrelandIsraelItalyJamaicaJapanJordanKazakhstanKenyaKiribatiKorea, Rep.KuwaitKyrgyz RepublicLao PDRLate-demographic dividendLatin America & Caribbean Latin America & Caribbean (excluding high income)Latin America & the Caribbean (IDA & IBRD countries)LatviaLeast developed countries: UN classificationLebanonLesothoLiberiaLibyaLithuaniaLow & middle incomeLower middle incomeLuxembourgMacao SAR, ChinaMacedonia, FYRMadagascarMalawiMalaysiaMaldivesMaliMaltaMauritaniaMauritiusMexicoMiddle East & North AfricaMiddle East & North Africa (excluding high income)Middle East & North Africa (IDA & IBRD countries)Middle incomeMoldovaMongoliaMoroccoMozambiqueMyanmarNamibiaNepalNetherlandsNew CaledoniaNew ZealandNicaraguaNigerNigeriaNorth AmericaNorwayOECD membersOmanOther small statesPacific island small statesPakistanPalauPanamaPapua New GuineaParaguayPeruPhilippinesPolandPortugalPost-demographic dividendPre-demographic dividendQatarRomaniaRussian FederationRwandaSamoaSao Tome and PrincipeSaudi ArabiaSenegalSerbiaSeychellesSierra LeoneSingaporeSlovak RepublicSloveniaSmall statesSolomon IslandsSomaliaSouth AfricaSouth AsiaSouth Asia (IDA & IBRD)SpainSri LankaSt. Kitts and NevisSt. LuciaSt. Vincent and the GrenadinesSub-Saharan Africa Sub-Saharan Africa (excluding high income)Sub-Saharan Africa (IDA & IBRD countries)SudanSurinameSwazilandSwedenSwitzerlandSyrian Arab RepublicTajikistanTanzaniaThailandTimor-LesteTogoTongaTrinidad and TobagoTunisiaTurkeyTurkmenistanTurks and Caicos IslandsTuvaluUgandaUkraineUnited Arab EmiratesUnited KingdomUnited StatesUpper middle incomeUruguayVanuatuVenezuela, RBVietnamVirgin Islands (U.S.)WorldYemen, Rep.ZambiaZimbabwe Timeline:
This timeline shows a graph from 1963 to 2016 of Korea, Rep.. No data until 1962. Number of actual observations by date: 54.
Source name:
World Development Indicators
Source organization:
World Bank staff estimates from the Comtrade database maintained by the United Nations Statistics Division.
Categories, topics:
Agriculture & Rural Development, Private Sector, Trade
Last updated:
apr 23, 2017
Indicators value changes by year
At the date of observation
Value
Absolute change
Change from previous value
jan 1, 1963
13.354
+13.354
0.0%
jan 1, 1964
16.39
+3.036
22.74%
jan 1, 1965
11.35
-5.04
-30.75%
jan 1, 1966
8.544
-2.805
-24.72%
jan 1, 1967
8.409
-0.135
-1.58%
jan 1, 1968
9.566
+1.156
13.75%
jan 1, 1969
6.468
-3.098
-32.38%
jan 1, 1970
6.361
-0.107
-1.65%
jan 1, 1971
7.08
+0.719
11.3%
jan 1, 1972
5.758
-1.322
-18.67%
jan 1, 1973
5.366
-0.392
-6.8%
jan 1, 1974
4.786
-0.58
-10.81%
jan 1, 1975
3.039
-1.747
-36.5%
jan 1, 1976
1.819
-1.22
-40.14%
jan 1, 1977
1.692
-0.128
-7.01%
jan 1, 1978
2.214
+0.523
30.89%
jan 1, 1979
1.96
-0.254
-11.46%
jan 1, 1980
1.782
-0.178
-9.1%
jan 1, 1981
1.373
-0.409
-22.95%
jan 1, 1982
0.921
-0.452
-32.95%
jan 1, 1983
0.826
-0.094
-10.26%
jan 1, 1984
0.761
-0.065
-7.91%
jan 1, 1985
0.836
+0.075
9.88%
jan 1, 1986
0.769
-0.067
-8.03%
jan 1, 1987
0.735
-0.034
-4.41%
jan 1, 1988
0.749
+0.014
1.93%
jan 1, 1989
0.954
+0.205
27.38%
jan 1, 1990
1.198
+0.244
25.55%
jan 1, 1991
1.27
+0.072
5.97%
jan 1, 1992
1.17
-0.1
-7.85%
jan 1, 1993
1.204
+0.034
2.88%
jan 1, 1994
1.23
+0.027
2.2%
jan 1, 1995
1.323
+0.093
7.56%
jan 1, 1996
1.324
+0.001
0.05%
jan 1, 1997
1.162
-0.162
-12.23%
jan 1, 1998
1.221
+0.059
5.09%
jan 1, 1999
1.106
-0.115
-9.42%
jan 1, 2000
1.003
-0.103
-9.35%
jan 1, 2001
0.957
-0.046
-4.59%
jan 1, 2002
0.953
-0.003
-0.33%
jan 1, 2003
0.868
-0.085
-8.92%
jan 1, 2004
0.859
-0.01
-1.1%
jan 1, 2005
0.791
-0.068
-7.93%
jan 1, 2006
0.801
+0.01
1.3%
jan 1, 2007
0.727
-0.074
-9.2%
jan 1, 2008
0.795
+0.068
9.35%
jan 1, 2009
0.872
+0.077
9.62%
jan 1, 2010
0.839
-0.033
-3.76%
jan 1, 2011
0.933
+0.094
11.22%
jan 1, 2012
1.178
+0.244
26.19%
jan 1, 2013
1.137
-0.041
-3.46%
jan 1, 2014
0.996
-0.141
-12.39%
jan 1, 2015
0.923
-0.073
-7.34%
jan 1, 2016
0.829
-0.094
-10.19%
Ranking of countries by current statistics by years


Comments: