29
/
en
AIzaSyAYiBZKx7MnpbEhh9jyipgxe19OcubqV5w
April 1, 2024
30455
Europe & Central Asia
ECS
false
2
1
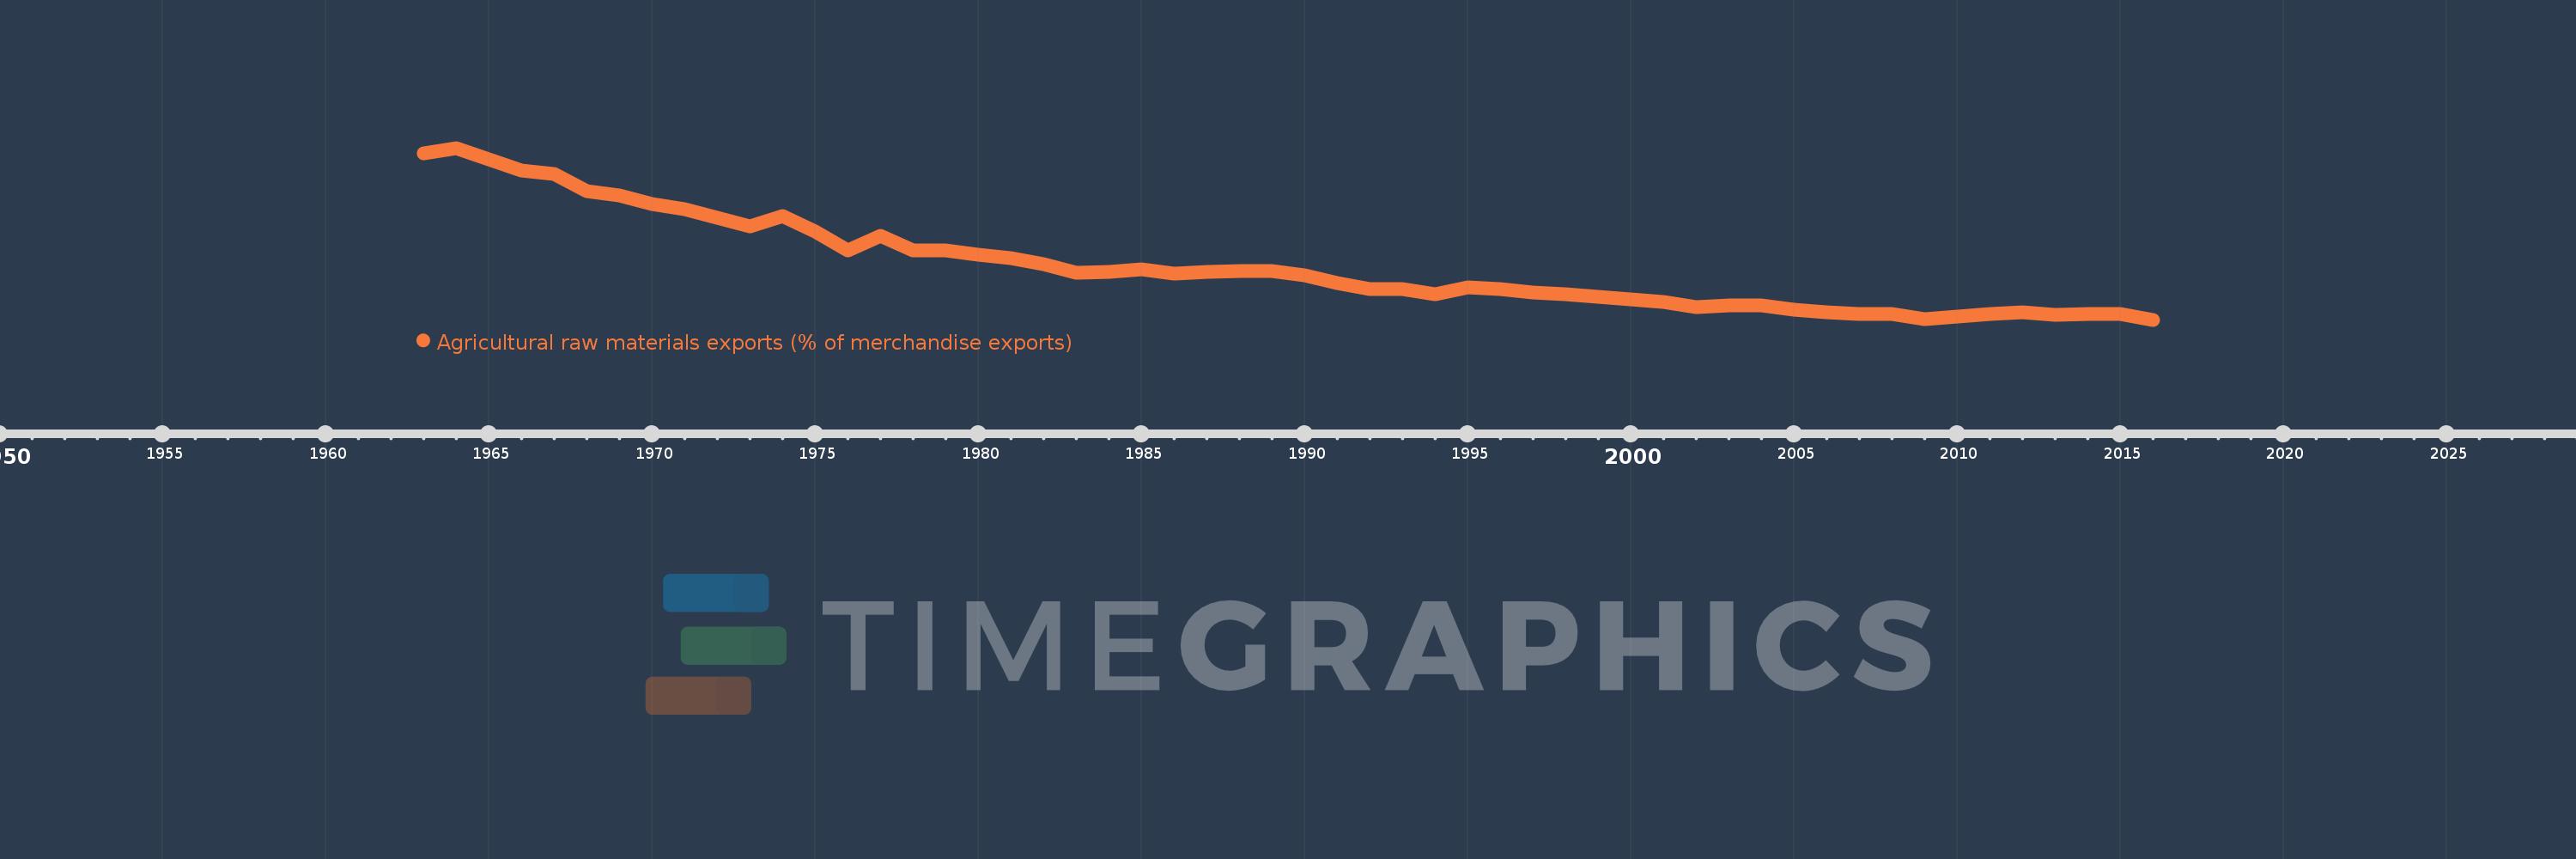
Agricultural raw materials exports (% of merchandise exports)
2016,2015,2014,2013,2012,2011,2010,2009,2008,2007,2006,2005,2004,2003,2002,2001,2000,1999,1998,1997,1996,1995,1994,1993,1992,1991,1990,1989,1988,1987,1986,1985,1984,1983,1982,1981,1980,1979,1978,1977,1976,1975,1974,1973,1972,1971,1970,1969,1968,1967,1966,1965,1964,1963
This statistics in other country:
AfghanistanAlbaniaAlgeriaAndorraAngolaAntigua and BarbudaArab WorldArgentinaArmeniaArubaAustraliaAustriaAzerbaijanBahamas, TheBahrainBangladeshBarbadosBelarusBelgiumBelizeBeninBermudaBhutanBoliviaBosnia and HerzegovinaBotswanaBrazilBrunei DarussalamBulgariaBurkina FasoBurundiCabo VerdeCambodiaCameroonCanadaCaribbean small statesCayman IslandsCentral African RepublicCentral Europe and the BalticsChadChileChinaColombiaComorosCongo, Dem. Rep.Congo, Rep.Costa RicaCote d'IvoireCroatiaCubaCyprusCzech RepublicDenmarkDjiboutiDominicaDominican RepublicEarly-demographic dividendEast Asia & PacificEast Asia & Pacific (excluding high income)East Asia & Pacific (IDA & IBRD countries)EcuadorEgypt, Arab Rep.El SalvadorEquatorial GuineaEritreaEstoniaEthiopiaEuro areaEurope & Central AsiaEurope & Central Asia (excluding high income)Europe & Central Asia (IDA & IBRD countries)European UnionFaroe IslandsFijiFinlandFragile and conflict affected situationsFranceFrench PolynesiaGabonGambia, TheGeorgiaGermanyGhanaGreeceGreenlandGrenadaGuatemalaGuineaGuinea-BissauGuyanaHaitiHeavily indebted poor countries (HIPC)High incomeHondurasHong Kong SAR, ChinaHungaryIBRD onlyIcelandIDA & IBRD totalIDA blendIDA onlyIDA totalIndiaIndonesiaIran, Islamic Rep.IraqIrelandIsraelItalyJamaicaJapanJordanKazakhstanKenyaKiribatiKorea, Rep.KuwaitKyrgyz RepublicLao PDRLate-demographic dividendLatin America & Caribbean Latin America & Caribbean (excluding high income)Latin America & the Caribbean (IDA & IBRD countries)LatviaLeast developed countries: UN classificationLebanonLesothoLiberiaLibyaLithuaniaLow & middle incomeLower middle incomeLuxembourgMacao SAR, ChinaMacedonia, FYRMadagascarMalawiMalaysiaMaldivesMaliMaltaMauritaniaMauritiusMexicoMiddle East & North AfricaMiddle East & North Africa (excluding high income)Middle East & North Africa (IDA & IBRD countries)Middle incomeMoldovaMongoliaMoroccoMozambiqueMyanmarNamibiaNepalNetherlandsNew CaledoniaNew ZealandNicaraguaNigerNigeriaNorth AmericaNorwayOECD membersOmanOther small statesPacific island small statesPakistanPalauPanamaPapua New GuineaParaguayPeruPhilippinesPolandPortugalPost-demographic dividendPre-demographic dividendQatarRomaniaRussian FederationRwandaSamoaSao Tome and PrincipeSaudi ArabiaSenegalSerbiaSeychellesSierra LeoneSingaporeSlovak RepublicSloveniaSmall statesSolomon IslandsSomaliaSouth AfricaSouth AsiaSouth Asia (IDA & IBRD)SpainSri LankaSt. Kitts and NevisSt. LuciaSt. Vincent and the GrenadinesSub-Saharan Africa Sub-Saharan Africa (excluding high income)Sub-Saharan Africa (IDA & IBRD countries)SudanSurinameSwazilandSwedenSwitzerlandSyrian Arab RepublicTajikistanTanzaniaThailandTimor-LesteTogoTongaTrinidad and TobagoTunisiaTurkeyTurkmenistanTurks and Caicos IslandsTuvaluUgandaUkraineUnited Arab EmiratesUnited KingdomUnited StatesUpper middle incomeUruguayVanuatuVenezuela, RBVietnamVirgin Islands (U.S.)WorldYemen, Rep.ZambiaZimbabwe Timeline:
This timeline shows a graph from 1963 to 2016 of Europe & Central Asia. No data until 1962. Number of actual observations by date: 54.
Source name:
World Development Indicators
Source organization:
World Bank staff estimates from the Comtrade database maintained by the United Nations Statistics Division.
Categories, topics:
Agriculture & Rural Development, Private Sector, Trade
Last updated:
apr 23, 2017
Indicators value changes by year
At the date of observation
Value
Absolute change
Change from previous value
jan 1, 1963
5.679
+5.679
0.0%
jan 1, 1964
5.831
+0.152
2.67%
jan 1, 1965
5.531
-0.3
-5.14%
jan 1, 1966
5.224
-0.308
-5.56%
jan 1, 1967
5.129
-0.095
-1.82%
jan 1, 1968
4.672
-0.457
-8.91%
jan 1, 1969
4.561
-0.111
-2.37%
jan 1, 1970
4.323
-0.238
-5.21%
jan 1, 1971
4.192
-0.131
-3.03%
jan 1, 1972
3.968
-0.224
-5.34%
jan 1, 1973
3.727
-0.241
-6.08%
jan 1, 1974
4.007
+0.28
7.52%
jan 1, 1975
3.591
-0.416
-10.39%
jan 1, 1976
3.086
-0.505
-14.07%
jan 1, 1977
3.478
+0.393
12.73%
jan 1, 1978
3.094
-0.384
-11.04%
jan 1, 1979
3.087
-0.007
-0.23%
jan 1, 1980
2.979
-0.108
-3.51%
jan 1, 1981
2.881
-0.097
-3.27%
jan 1, 1982
2.721
-0.161
-5.58%
jan 1, 1983
2.494
-0.226
-8.32%
jan 1, 1984
2.516
+0.021
0.85%
jan 1, 1985
2.585
+0.069
2.74%
jan 1, 1986
2.464
-0.121
-4.68%
jan 1, 1987
2.512
+0.049
1.98%
jan 1, 1988
2.537
+0.025
0.98%
jan 1, 1989
2.547
+0.01
0.38%
jan 1, 1990
2.423
-0.124
-4.85%
jan 1, 1991
2.213
-0.21
-8.68%
jan 1, 1992
2.059
-0.153
-6.93%
jan 1, 1993
2.06
+0.001
0.05%
jan 1, 1994
1.917
-0.143
-6.95%
jan 1, 1995
2.104
+0.187
9.73%
jan 1, 1996
2.069
-0.035
-1.67%
jan 1, 1997
1.959
-0.11
-5.3%
jan 1, 1998
1.933
-0.025
-1.3%
jan 1, 1999
1.861
-0.072
-3.74%
jan 1, 2000
1.779
-0.082
-4.43%
jan 1, 2001
1.721
-0.057
-3.22%
jan 1, 2002
1.587
-0.134
-7.8%
jan 1, 2003
1.636
+0.049
3.07%
jan 1, 2004
1.618
-0.018
-1.08%
jan 1, 2005
1.52
-0.099
-6.09%
jan 1, 2006
1.438
-0.081
-5.36%
jan 1, 2007
1.396
-0.043
-2.97%
jan 1, 2008
1.4
+0.004
0.32%
jan 1, 2009
1.247
-0.153
-10.91%
jan 1, 2010
1.317
+0.07
5.6%
jan 1, 2011
1.386
+0.068
5.2%
jan 1, 2012
1.443
+0.057
4.11%
jan 1, 2013
1.375
-0.068
-4.7%
jan 1, 2014
1.406
+0.031
2.26%
jan 1, 2015
1.391
-0.015
-1.08%
jan 1, 2016
1.242
-0.149
-10.72%
Ranking of countries by current statistics by years


Comments: