29
/
en
AIzaSyAYiBZKx7MnpbEhh9jyipgxe19OcubqV5w
April 1, 2024
94252
Bulgaria
BGR
true
2
1
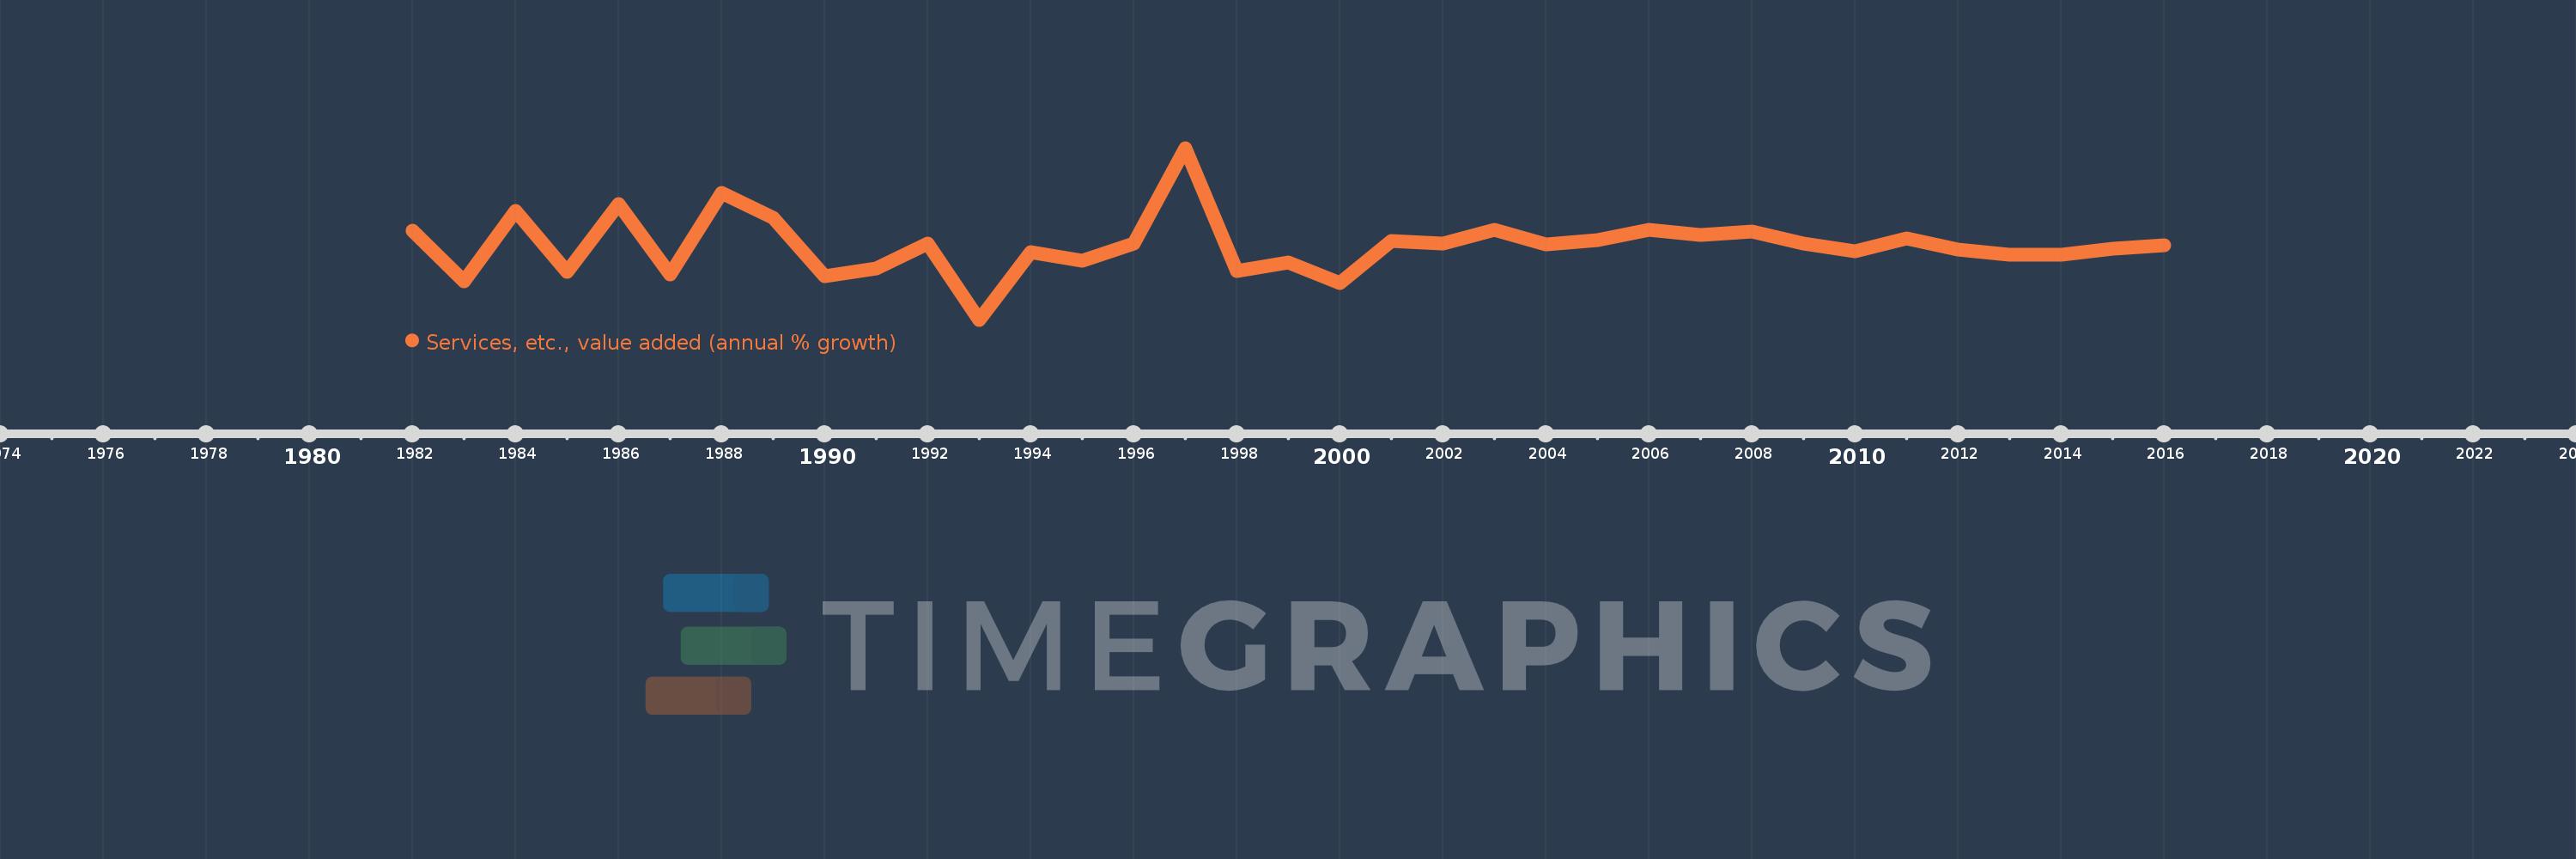
Services, etc., value added (annual % growth)
2016,2015,2014,2013,2012,2011,2010,2009,2008,2007,2006,2005,2004,2003,2002,2001,2000,1999,1998,1997,1996,1995,1994,1993,1992,1991,1990,1989,1988,1987,1986,1985,1984,1983,1982
This statistics in other country:
AfghanistanAlbaniaAlgeriaAntigua and BarbudaArab WorldArgentinaArmeniaAustraliaAustriaAzerbaijanBahamas, TheBahrainBangladeshBelarusBelgiumBelizeBeninBermudaBhutanBoliviaBosnia and HerzegovinaBotswanaBrazilBrunei DarussalamBulgariaBurkina FasoBurundiCabo VerdeCambodiaCameroonCanadaCaribbean small statesCentral African RepublicCentral Europe and the BalticsChadChileChinaColombiaComorosCongo, Dem. Rep.Congo, Rep.Costa RicaCote d'IvoireCroatiaCubaCyprusCzech RepublicDenmarkDjiboutiDominicaDominican RepublicEarly-demographic dividendEast Asia & PacificEast Asia & Pacific (excluding high income)East Asia & Pacific (IDA & IBRD countries)EcuadorEgypt, Arab Rep.El SalvadorEquatorial GuineaEritreaEstoniaEthiopiaEuro areaEurope & Central AsiaEurope & Central Asia (excluding high income)Europe & Central Asia (IDA & IBRD countries)European UnionFijiFinlandFragile and conflict affected situationsFranceGabonGambia, TheGeorgiaGermanyGhanaGreeceGrenadaGuatemalaGuineaGuinea-BissauGuyanaHaitiHeavily indebted poor countries (HIPC)High incomeHondurasHong Kong SAR, ChinaHungaryIBRD onlyIcelandIDA & IBRD totalIDA blendIDA onlyIDA totalIndiaIndonesiaIran, Islamic Rep.IraqIrelandItalyJamaicaJapanJordanKazakhstanKenyaKiribatiKorea, Rep.KosovoKuwaitKyrgyz RepublicLao PDRLate-demographic dividendLatin America & Caribbean Latin America & Caribbean (excluding high income)Latin America & the Caribbean (IDA & IBRD countries)LatviaLeast developed countries: UN classificationLebanonLesothoLiberiaLithuaniaLow & middle incomeLow incomeLower middle incomeLuxembourgMacedonia, FYRMadagascarMalawiMalaysiaMaldivesMaliMarshall IslandsMauritaniaMauritiusMexicoMicronesia, Fed. Sts.Middle East & North AfricaMiddle East & North Africa (excluding high income)Middle East & North Africa (IDA & IBRD countries)Middle incomeMoldovaMongoliaMontenegroMoroccoMozambiqueMyanmarNamibiaNepalNetherlandsNew ZealandNicaraguaNigerNigeriaNorth AmericaNorwayOECD membersOmanOther small statesPacific island small statesPakistanPalauPanamaPapua New GuineaParaguayPeruPhilippinesPolandPortugalPost-demographic dividendPre-demographic dividendPuerto RicoQatarRomaniaRussian FederationRwandaSamoaSao Tome and PrincipeSaudi ArabiaSenegalSerbiaSeychellesSierra LeoneSingaporeSlovak RepublicSloveniaSmall statesSolomon IslandsSomaliaSouth AfricaSouth AsiaSouth Asia (IDA & IBRD)SpainSri LankaSt. Kitts and NevisSt. LuciaSt. Vincent and the GrenadinesSub-Saharan Africa Sub-Saharan Africa (excluding high income)Sub-Saharan Africa (IDA & IBRD countries)SudanSurinameSwazilandSwedenSwitzerlandSyrian Arab RepublicTajikistanTanzaniaThailandTimor-LesteTogoTongaTrinidad and TobagoTunisiaTurkeyTurkmenistanTuvaluUgandaUkraineUnited Arab EmiratesUnited KingdomUnited StatesUpper middle incomeUruguayUzbekistanVanuatuVenezuela, RBVietnamWest Bank and GazaWorldZambiaZimbabwe Timeline:
This timeline shows a graph from 1982 to 2016 of Bulgaria. No data until 1981. Number of actual observations by date: 35.
Source name:
World Development Indicators
Source organization:
World Bank national accounts data, and OECD National Accounts data files.
Categories, topics:
Economy & Growth
Last updated:
apr 23, 2017
Indicators value changes by year
Maximum:
42.671
jan 1, 1997
At the date of observation
Value
Absolute change
Change from previous value
jan 1, 1982
9.327
+9.327
0.0%
jan 1, 1983
-11.316
-20.643
-221.31%
jan 1, 1984
17.099
+28.415
-251.11%
jan 1, 1985
-7.668
-24.767
-144.85%
jan 1, 1986
19.823
+27.491
-358.5%
jan 1, 1987
-8.558
-28.381
-143.17%
jan 1, 1988
24.546
+33.104
-386.81%
jan 1, 1989
14.536
-10.01
-40.78%
jan 1, 1990
-9.194
-23.73
-163.25%
jan 1, 1991
-6.058
+3.136
-34.11%
jan 1, 1992
4.049
+10.107
-166.84%
jan 1, 1993
-26.9
-30.949
-764.31%
jan 1, 1994
0.6
+27.5
-102.23%
jan 1, 1995
-3.1
-3.7
-616.67%
jan 1, 1996
4.0
+7.1
-229.03%
jan 1, 1997
42.671
+38.671
966.77%
jan 1, 1998
-7.335
-50.006
-117.19%
jan 1, 1999
-3.529
+3.806
-51.89%
jan 1, 2000
-11.926
-8.397
237.97%
jan 1, 2001
5.125
+17.051
-142.97%
jan 1, 2002
3.837
-1.288
-25.13%
jan 1, 2003
9.434
+5.597
145.89%
jan 1, 2004
3.644
-5.79
-61.38%
jan 1, 2005
5.437
+1.793
49.21%
jan 1, 2006
9.584
+4.147
76.28%
jan 1, 2007
7.313
-2.271
-23.7%
jan 1, 2008
8.82
+1.507
20.61%
jan 1, 2009
4.055
-4.765
-54.03%
jan 1, 2010
0.807
-3.248
-80.1%
jan 1, 2011
6.052
+5.245
650.21%
jan 1, 2012
1.407
-4.645
-76.75%
jan 1, 2013
-0.484
-1.891
-134.4%
jan 1, 2014
-0.469
+0.015
-3.04%
jan 1, 2015
1.745
+2.214
-471.92%
jan 1, 2016
3.347
+1.601
91.77%
Ranking of countries by current statistics by years


Comments: