29
/
en
AIzaSyAYiBZKx7MnpbEhh9jyipgxe19OcubqV5w
April 1, 2024
66705
Algeria
DZA
true
2
1
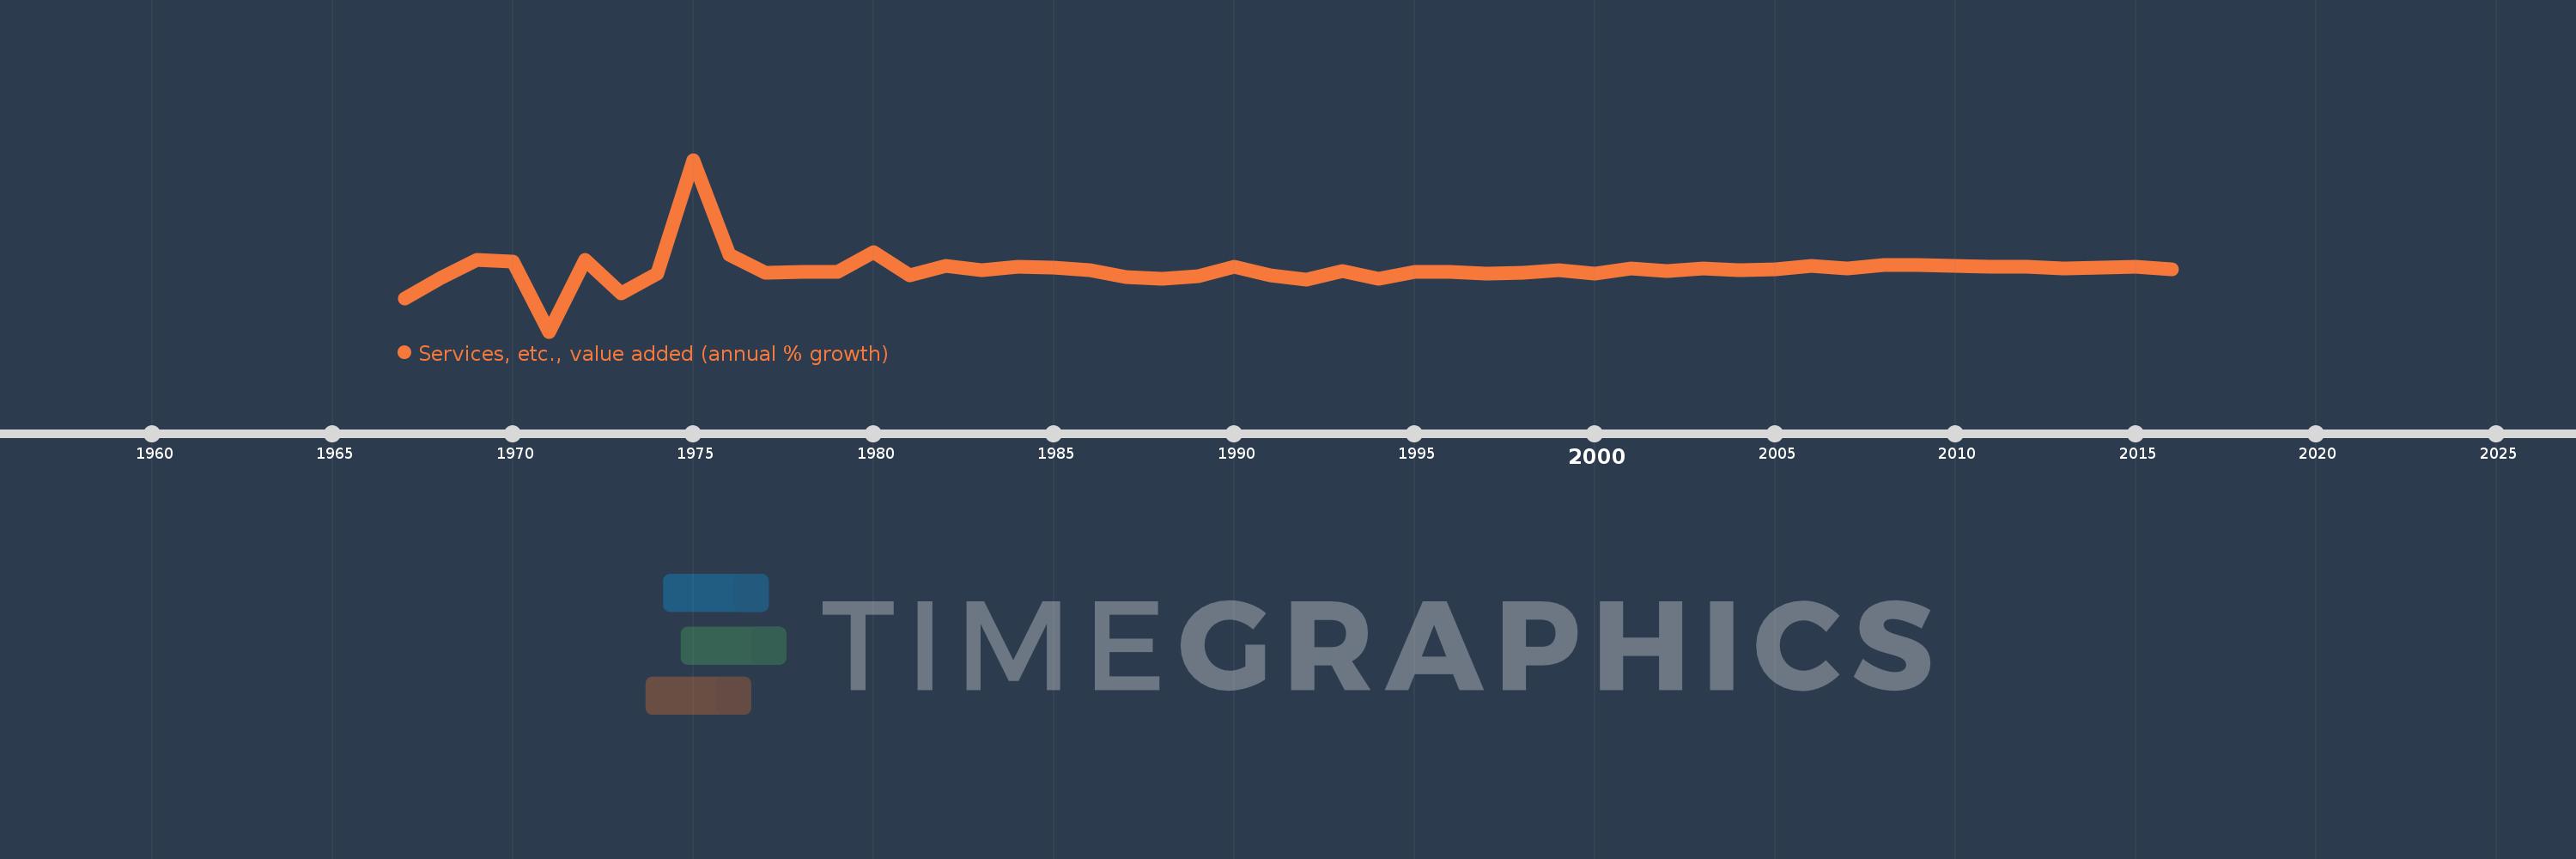
Services, etc., value added (annual % growth)
2016,2015,2014,2013,2012,2011,2010,2009,2008,2007,2006,2005,2004,2003,2002,2001,2000,1999,1998,1997,1996,1995,1994,1993,1992,1991,1990,1989,1988,1987,1986,1985,1984,1983,1982,1981,1980,1979,1978,1977,1976,1975,1974,1973,1972,1971,1970,1969,1968,1967
This statistics in other country:
AfghanistanAlbaniaAlgeriaAntigua and BarbudaArab WorldArgentinaArmeniaAustraliaAustriaAzerbaijanBahamas, TheBahrainBangladeshBelarusBelgiumBelizeBeninBermudaBhutanBoliviaBosnia and HerzegovinaBotswanaBrazilBrunei DarussalamBulgariaBurkina FasoBurundiCabo VerdeCambodiaCameroonCanadaCaribbean small statesCentral African RepublicCentral Europe and the BalticsChadChileChinaColombiaComorosCongo, Dem. Rep.Congo, Rep.Costa RicaCote d'IvoireCroatiaCubaCyprusCzech RepublicDenmarkDjiboutiDominicaDominican RepublicEarly-demographic dividendEast Asia & PacificEast Asia & Pacific (excluding high income)East Asia & Pacific (IDA & IBRD countries)EcuadorEgypt, Arab Rep.El SalvadorEquatorial GuineaEritreaEstoniaEthiopiaEuro areaEurope & Central AsiaEurope & Central Asia (excluding high income)Europe & Central Asia (IDA & IBRD countries)European UnionFijiFinlandFragile and conflict affected situationsFranceGabonGambia, TheGeorgiaGermanyGhanaGreeceGrenadaGuatemalaGuineaGuinea-BissauGuyanaHaitiHeavily indebted poor countries (HIPC)High incomeHondurasHong Kong SAR, ChinaHungaryIBRD onlyIcelandIDA & IBRD totalIDA blendIDA onlyIDA totalIndiaIndonesiaIran, Islamic Rep.IraqIrelandItalyJamaicaJapanJordanKazakhstanKenyaKiribatiKorea, Rep.KosovoKuwaitKyrgyz RepublicLao PDRLate-demographic dividendLatin America & Caribbean Latin America & Caribbean (excluding high income)Latin America & the Caribbean (IDA & IBRD countries)LatviaLeast developed countries: UN classificationLebanonLesothoLiberiaLithuaniaLow & middle incomeLow incomeLower middle incomeLuxembourgMacedonia, FYRMadagascarMalawiMalaysiaMaldivesMaliMarshall IslandsMauritaniaMauritiusMexicoMicronesia, Fed. Sts.Middle East & North AfricaMiddle East & North Africa (excluding high income)Middle East & North Africa (IDA & IBRD countries)Middle incomeMoldovaMongoliaMontenegroMoroccoMozambiqueMyanmarNamibiaNepalNetherlandsNew ZealandNicaraguaNigerNigeriaNorth AmericaNorwayOECD membersOmanOther small statesPacific island small statesPakistanPalauPanamaPapua New GuineaParaguayPeruPhilippinesPolandPortugalPost-demographic dividendPre-demographic dividendPuerto RicoQatarRomaniaRussian FederationRwandaSamoaSao Tome and PrincipeSaudi ArabiaSenegalSerbiaSeychellesSierra LeoneSingaporeSlovak RepublicSloveniaSmall statesSolomon IslandsSomaliaSouth AfricaSouth AsiaSouth Asia (IDA & IBRD)SpainSri LankaSt. Kitts and NevisSt. LuciaSt. Vincent and the GrenadinesSub-Saharan Africa Sub-Saharan Africa (excluding high income)Sub-Saharan Africa (IDA & IBRD countries)SudanSurinameSwazilandSwedenSwitzerlandSyrian Arab RepublicTajikistanTanzaniaThailandTimor-LesteTogoTongaTrinidad and TobagoTunisiaTurkeyTurkmenistanTuvaluUgandaUkraineUnited Arab EmiratesUnited KingdomUnited StatesUpper middle incomeUruguayUzbekistanVanuatuVenezuela, RBVietnamWest Bank and GazaWorldZambiaZimbabwe Timeline:
This timeline shows a graph from 1967 to 2016 of Algeria. No data until 1966. Number of actual observations by date: 50.
Source name:
World Development Indicators
Source organization:
World Bank national accounts data, and OECD National Accounts data files.
Categories, topics:
Economy & Growth
Last updated:
apr 23, 2017
Indicators value changes by year
Minimum:
-41.045
jan 1, 1971
Maximum:
85.663
jan 1, 1975
At the date of observation
Value
Absolute change
Change from previous value
jan 1, 1967
-16.724
-16.724
0.0%
jan 1, 1968
-1.639
+15.084
-90.2%
jan 1, 1969
11.667
+13.306
-811.67%
jan 1, 1970
10.821
-0.846
-7.25%
jan 1, 1971
-41.045
-51.865
-479.31%
jan 1, 1972
12.003
+53.048
-129.24%
jan 1, 1973
-12.637
-24.641
-205.28%
jan 1, 1974
1.877
+14.514
-114.85%
jan 1, 1975
85.663
+83.786
4.46K%
jan 1, 1976
15.621
-70.042
-81.76%
jan 1, 1977
2.068
-13.554
-86.76%
jan 1, 1978
3.2
+1.133
54.78%
jan 1, 1979
2.871
-0.329
-10.29%
jan 1, 1980
17.271
+14.4
501.53%
jan 1, 1981
0.524
-16.747
-96.97%
jan 1, 1982
7.536
+7.013
1.34K%
jan 1, 1983
4.483
-3.054
-40.52%
jan 1, 1984
7.055
+2.572
57.38%
jan 1, 1985
6.241
-0.814
-11.54%
jan 1, 1986
4.309
-1.932
-30.96%
jan 1, 1987
-0.628
-4.937
-114.56%
jan 1, 1988
-1.986
-1.358
216.44%
jan 1, 1989
-0.053
+1.933
-97.33%
jan 1, 1990
6.57
+6.623
-12.49K%
jan 1, 1991
0.373
-6.197
-94.32%
jan 1, 1992
-2.698
-3.071
-823.57%
jan 1, 1993
3.775
+6.474
-239.91%
jan 1, 1994
-1.972
-5.748
-152.24%
jan 1, 1995
2.969
+4.941
-250.54%
jan 1, 1996
2.802
-0.167
-5.61%
jan 1, 1997
1.429
-1.374
-49.02%
jan 1, 1998
2.217
+0.788
55.16%
jan 1, 1999
4.255
+2.039
91.96%
jan 1, 2000
1.662
-2.593
-60.95%
jan 1, 2001
5.68
+4.019
241.82%
jan 1, 2002
3.828
-1.852
-32.61%
jan 1, 2003
5.751
+1.923
50.25%
jan 1, 2004
4.436
-1.315
-22.87%
jan 1, 2005
5.04
+0.604
13.6%
jan 1, 2006
7.137
+2.097
41.62%
jan 1, 2007
5.46
-1.677
-23.5%
jan 1, 2008
8.235
+2.775
50.83%
jan 1, 2009
7.954
-0.282
-3.42%
jan 1, 2010
7.599
-0.355
-4.46%
jan 1, 2011
6.76
-0.839
-11.04%
jan 1, 2012
6.615
-0.144
-2.14%
jan 1, 2013
5.325
-1.29
-19.5%
jan 1, 2014
6.098
+0.773
14.51%
jan 1, 2015
6.565
+0.467
7.66%
jan 1, 2016
4.76
-1.805
-27.5%
Ranking of countries by current statistics by years


Comments: