29
/
en
AIzaSyAYiBZKx7MnpbEhh9jyipgxe19OcubqV5w
April 1, 2024
255820
Swaziland
SWZ
true
2
1
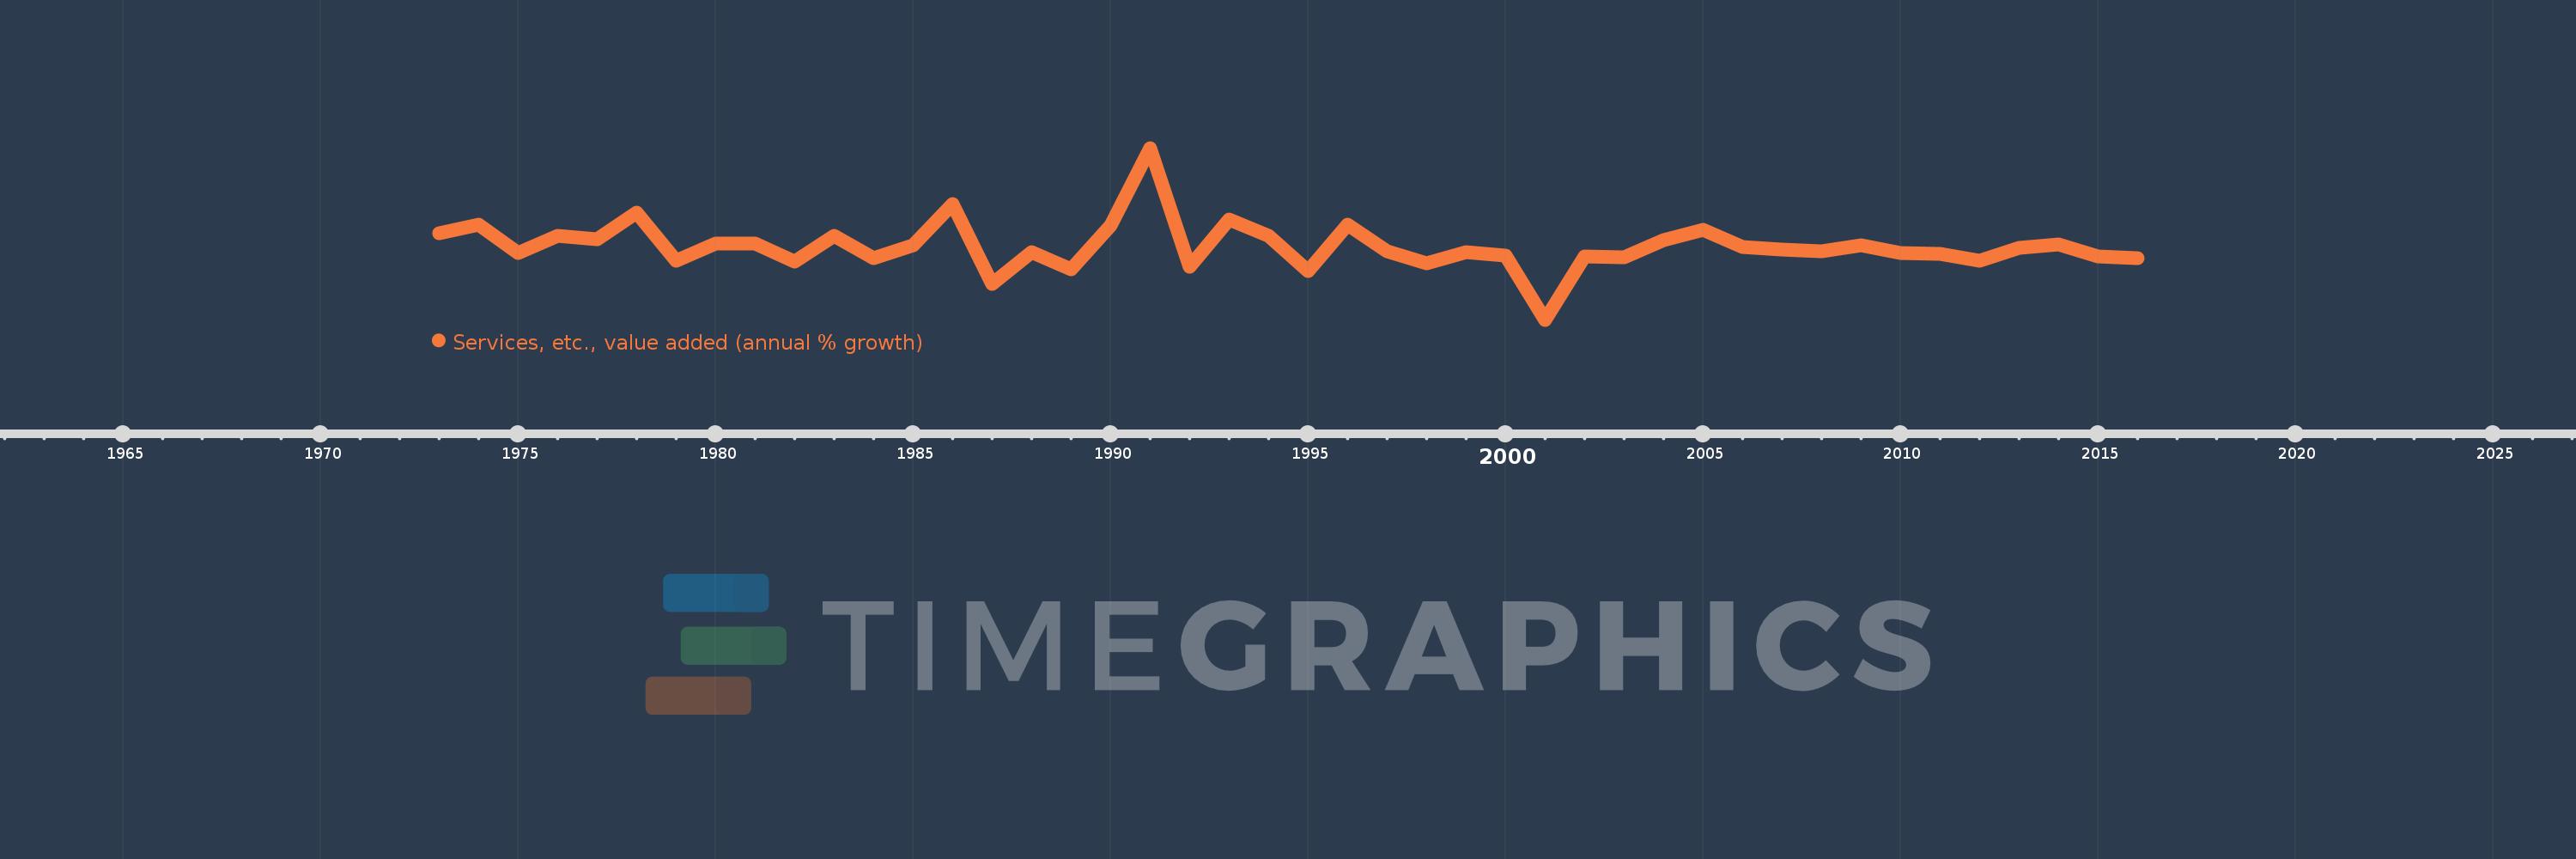
Services, etc., value added (annual % growth)
2016,2015,2014,2013,2012,2011,2010,2009,2008,2007,2006,2005,2004,2003,2002,2001,2000,1999,1998,1997,1996,1995,1994,1993,1992,1991,1990,1989,1988,1987,1986,1985,1984,1983,1982,1981,1980,1979,1978,1977,1976,1975,1974,1973
This statistics in other country:
AfghanistanAlbaniaAlgeriaAntigua and BarbudaArab WorldArgentinaArmeniaAustraliaAustriaAzerbaijanBahamas, TheBahrainBangladeshBelarusBelgiumBelizeBeninBermudaBhutanBoliviaBosnia and HerzegovinaBotswanaBrazilBrunei DarussalamBulgariaBurkina FasoBurundiCabo VerdeCambodiaCameroonCanadaCaribbean small statesCentral African RepublicCentral Europe and the BalticsChadChileChinaColombiaComorosCongo, Dem. Rep.Congo, Rep.Costa RicaCote d'IvoireCroatiaCubaCyprusCzech RepublicDenmarkDjiboutiDominicaDominican RepublicEarly-demographic dividendEast Asia & PacificEast Asia & Pacific (excluding high income)East Asia & Pacific (IDA & IBRD countries)EcuadorEgypt, Arab Rep.El SalvadorEquatorial GuineaEritreaEstoniaEthiopiaEuro areaEurope & Central AsiaEurope & Central Asia (excluding high income)Europe & Central Asia (IDA & IBRD countries)European UnionFijiFinlandFragile and conflict affected situationsFranceGabonGambia, TheGeorgiaGermanyGhanaGreeceGrenadaGuatemalaGuineaGuinea-BissauGuyanaHaitiHeavily indebted poor countries (HIPC)High incomeHondurasHong Kong SAR, ChinaHungaryIBRD onlyIcelandIDA & IBRD totalIDA blendIDA onlyIDA totalIndiaIndonesiaIran, Islamic Rep.IraqIrelandItalyJamaicaJapanJordanKazakhstanKenyaKiribatiKorea, Rep.KosovoKuwaitKyrgyz RepublicLao PDRLate-demographic dividendLatin America & Caribbean Latin America & Caribbean (excluding high income)Latin America & the Caribbean (IDA & IBRD countries)LatviaLeast developed countries: UN classificationLebanonLesothoLiberiaLithuaniaLow & middle incomeLow incomeLower middle incomeLuxembourgMacedonia, FYRMadagascarMalawiMalaysiaMaldivesMaliMarshall IslandsMauritaniaMauritiusMexicoMicronesia, Fed. Sts.Middle East & North AfricaMiddle East & North Africa (excluding high income)Middle East & North Africa (IDA & IBRD countries)Middle incomeMoldovaMongoliaMontenegroMoroccoMozambiqueMyanmarNamibiaNepalNetherlandsNew ZealandNicaraguaNigerNigeriaNorth AmericaNorwayOECD membersOmanOther small statesPacific island small statesPakistanPalauPanamaPapua New GuineaParaguayPeruPhilippinesPolandPortugalPost-demographic dividendPre-demographic dividendPuerto RicoQatarRomaniaRussian FederationRwandaSamoaSao Tome and PrincipeSaudi ArabiaSenegalSerbiaSeychellesSierra LeoneSingaporeSlovak RepublicSloveniaSmall statesSolomon IslandsSomaliaSouth AfricaSouth AsiaSouth Asia (IDA & IBRD)SpainSri LankaSt. Kitts and NevisSt. LuciaSt. Vincent and the GrenadinesSub-Saharan Africa Sub-Saharan Africa (excluding high income)Sub-Saharan Africa (IDA & IBRD countries)SudanSurinameSwazilandSwedenSwitzerlandSyrian Arab RepublicTajikistanTanzaniaThailandTimor-LesteTogoTongaTrinidad and TobagoTunisiaTurkeyTurkmenistanTuvaluUgandaUkraineUnited Arab EmiratesUnited KingdomUnited StatesUpper middle incomeUruguayUzbekistanVanuatuVenezuela, RBVietnamWest Bank and GazaWorldZambiaZimbabwe Timeline:
This timeline shows a graph from 1973 to 2016 of Swaziland. No data until 1972. Number of actual observations by date: 44.
Source name:
World Development Indicators
Source organization:
World Bank national accounts data, and OECD National Accounts data files.
Categories, topics:
Economy & Growth
Last updated:
apr 23, 2017
Indicators value changes by year
Minimum:
-15.998
jan 1, 2001
Maximum:
32.657
jan 1, 1991
At the date of observation
Value
Absolute change
Change from previous value
jan 1, 1973
8.442
+8.442
0.0%
jan 1, 1974
10.889
+2.447
28.99%
jan 1, 1975
2.785
-8.105
-74.43%
jan 1, 1976
7.838
+5.053
181.43%
jan 1, 1977
6.827
-1.011
-12.9%
jan 1, 1978
14.4
+7.573
110.94%
jan 1, 1979
0.702
-13.697
-95.12%
jan 1, 1980
5.612
+4.91
699.05%
jan 1, 1981
5.598
-0.015
-0.26%
jan 1, 1982
0.479
-5.119
-91.44%
jan 1, 1983
7.668
+7.189
1.5K%
jan 1, 1984
1.542
-6.126
-79.89%
jan 1, 1985
5.146
+3.604
233.75%
jan 1, 1986
16.712
+11.566
224.75%
jan 1, 1987
-5.946
-22.659
-135.58%
jan 1, 1988
3.171
+9.118
-153.33%
jan 1, 1989
-1.802
-4.973
-156.82%
jan 1, 1990
10.761
+12.562
-697.17%
jan 1, 1991
32.657
+21.897
203.49%
jan 1, 1992
-1.055
-33.712
-103.23%
jan 1, 1993
12.299
+13.354
-1.27K%
jan 1, 1994
7.656
-4.643
-37.75%
jan 1, 1995
-2.253
-9.909
-129.43%
jan 1, 1996
10.941
+13.194
-585.56%
jan 1, 1997
3.382
-7.559
-69.09%
jan 1, 1998
-0.046
-3.427
-101.35%
jan 1, 1999
3.034
+3.08
-6.75K%
jan 1, 2000
2.284
-0.751
-24.73%
jan 1, 2001
-15.998
-18.282
-800.5%
jan 1, 2002
1.814
+17.813
-111.34%
jan 1, 2003
1.66
-0.155
-8.53%
jan 1, 2004
6.451
+4.792
288.73%
jan 1, 2005
9.397
+2.946
45.66%
jan 1, 2006
4.642
-4.755
-50.6%
jan 1, 2007
3.992
-0.65
-14.0%
jan 1, 2008
3.502
-0.491
-12.29%
jan 1, 2009
5.045
+1.543
44.07%
jan 1, 2010
2.809
-2.236
-44.32%
jan 1, 2011
2.671
-0.138
-4.91%
jan 1, 2012
0.669
-2.002
-74.94%
jan 1, 2013
4.357
+3.687
550.79%
jan 1, 2014
5.427
+1.07
24.56%
jan 1, 2015
1.861
-3.566
-65.71%
jan 1, 2016
1.544
-0.317
-17.05%
Ranking of countries by current statistics by years


Comments: