29
/
en
AIzaSyAYiBZKx7MnpbEhh9jyipgxe19OcubqV5w
April 1, 2024
236483
Senegal
SEN
true
2
1
Services, etc., value added (annual % growth)
2016,2015,2014,2013,2012,2011,2010,2009,2008,2007,2006,2005,2004,2003,2002,2001,2000,1999,1998,1997,1996,1995,1994,1993,1992,1991,1990,1989,1988,1987,1986,1985,1984,1983,1982,1981,1980,1979,1978,1977,1976,1975,1974,1973,1972,1971,1970,1969,1968,1967,1966,1965,1964,1963,1962
This statistics in other country:
AfghanistanAlbaniaAlgeriaAntigua and BarbudaArab WorldArgentinaArmeniaAustraliaAustriaAzerbaijanBahamas, TheBahrainBangladeshBelarusBelgiumBelizeBeninBermudaBhutanBoliviaBosnia and HerzegovinaBotswanaBrazilBrunei DarussalamBulgariaBurkina FasoBurundiCabo VerdeCambodiaCameroonCanadaCaribbean small statesCentral African RepublicCentral Europe and the BalticsChadChileChinaColombiaComorosCongo, Dem. Rep.Congo, Rep.Costa RicaCote d'IvoireCroatiaCubaCyprusCzech RepublicDenmarkDjiboutiDominicaDominican RepublicEarly-demographic dividendEast Asia & PacificEast Asia & Pacific (excluding high income)East Asia & Pacific (IDA & IBRD countries)EcuadorEgypt, Arab Rep.El SalvadorEquatorial GuineaEritreaEstoniaEthiopiaEuro areaEurope & Central AsiaEurope & Central Asia (excluding high income)Europe & Central Asia (IDA & IBRD countries)European UnionFijiFinlandFragile and conflict affected situationsFranceGabonGambia, TheGeorgiaGermanyGhanaGreeceGrenadaGuatemalaGuineaGuinea-BissauGuyanaHaitiHeavily indebted poor countries (HIPC)High incomeHondurasHong Kong SAR, ChinaHungaryIBRD onlyIcelandIDA & IBRD totalIDA blendIDA onlyIDA totalIndiaIndonesiaIran, Islamic Rep.IraqIrelandItalyJamaicaJapanJordanKazakhstanKenyaKiribatiKorea, Rep.KosovoKuwaitKyrgyz RepublicLao PDRLate-demographic dividendLatin America & Caribbean Latin America & Caribbean (excluding high income)Latin America & the Caribbean (IDA & IBRD countries)LatviaLeast developed countries: UN classificationLebanonLesothoLiberiaLithuaniaLow & middle incomeLow incomeLower middle incomeLuxembourgMacedonia, FYRMadagascarMalawiMalaysiaMaldivesMaliMarshall IslandsMauritaniaMauritiusMexicoMicronesia, Fed. Sts.Middle East & North AfricaMiddle East & North Africa (excluding high income)Middle East & North Africa (IDA & IBRD countries)Middle incomeMoldovaMongoliaMontenegroMoroccoMozambiqueMyanmarNamibiaNepalNetherlandsNew ZealandNicaraguaNigerNigeriaNorth AmericaNorwayOECD membersOmanOther small statesPacific island small statesPakistanPalauPanamaPapua New GuineaParaguayPeruPhilippinesPolandPortugalPost-demographic dividendPre-demographic dividendPuerto RicoQatarRomaniaRussian FederationRwandaSamoaSao Tome and PrincipeSaudi ArabiaSenegalSerbiaSeychellesSierra LeoneSingaporeSlovak RepublicSloveniaSmall statesSolomon IslandsSomaliaSouth AfricaSouth AsiaSouth Asia (IDA & IBRD)SpainSri LankaSt. Kitts and NevisSt. LuciaSt. Vincent and the GrenadinesSub-Saharan Africa Sub-Saharan Africa (excluding high income)Sub-Saharan Africa (IDA & IBRD countries)SudanSurinameSwazilandSwedenSwitzerlandSyrian Arab RepublicTajikistanTanzaniaThailandTimor-LesteTogoTongaTrinidad and TobagoTunisiaTurkeyTurkmenistanTuvaluUgandaUkraineUnited Arab EmiratesUnited KingdomUnited StatesUpper middle incomeUruguayUzbekistanVanuatuVenezuela, RBVietnamWest Bank and GazaWorldZambiaZimbabwe Timeline:
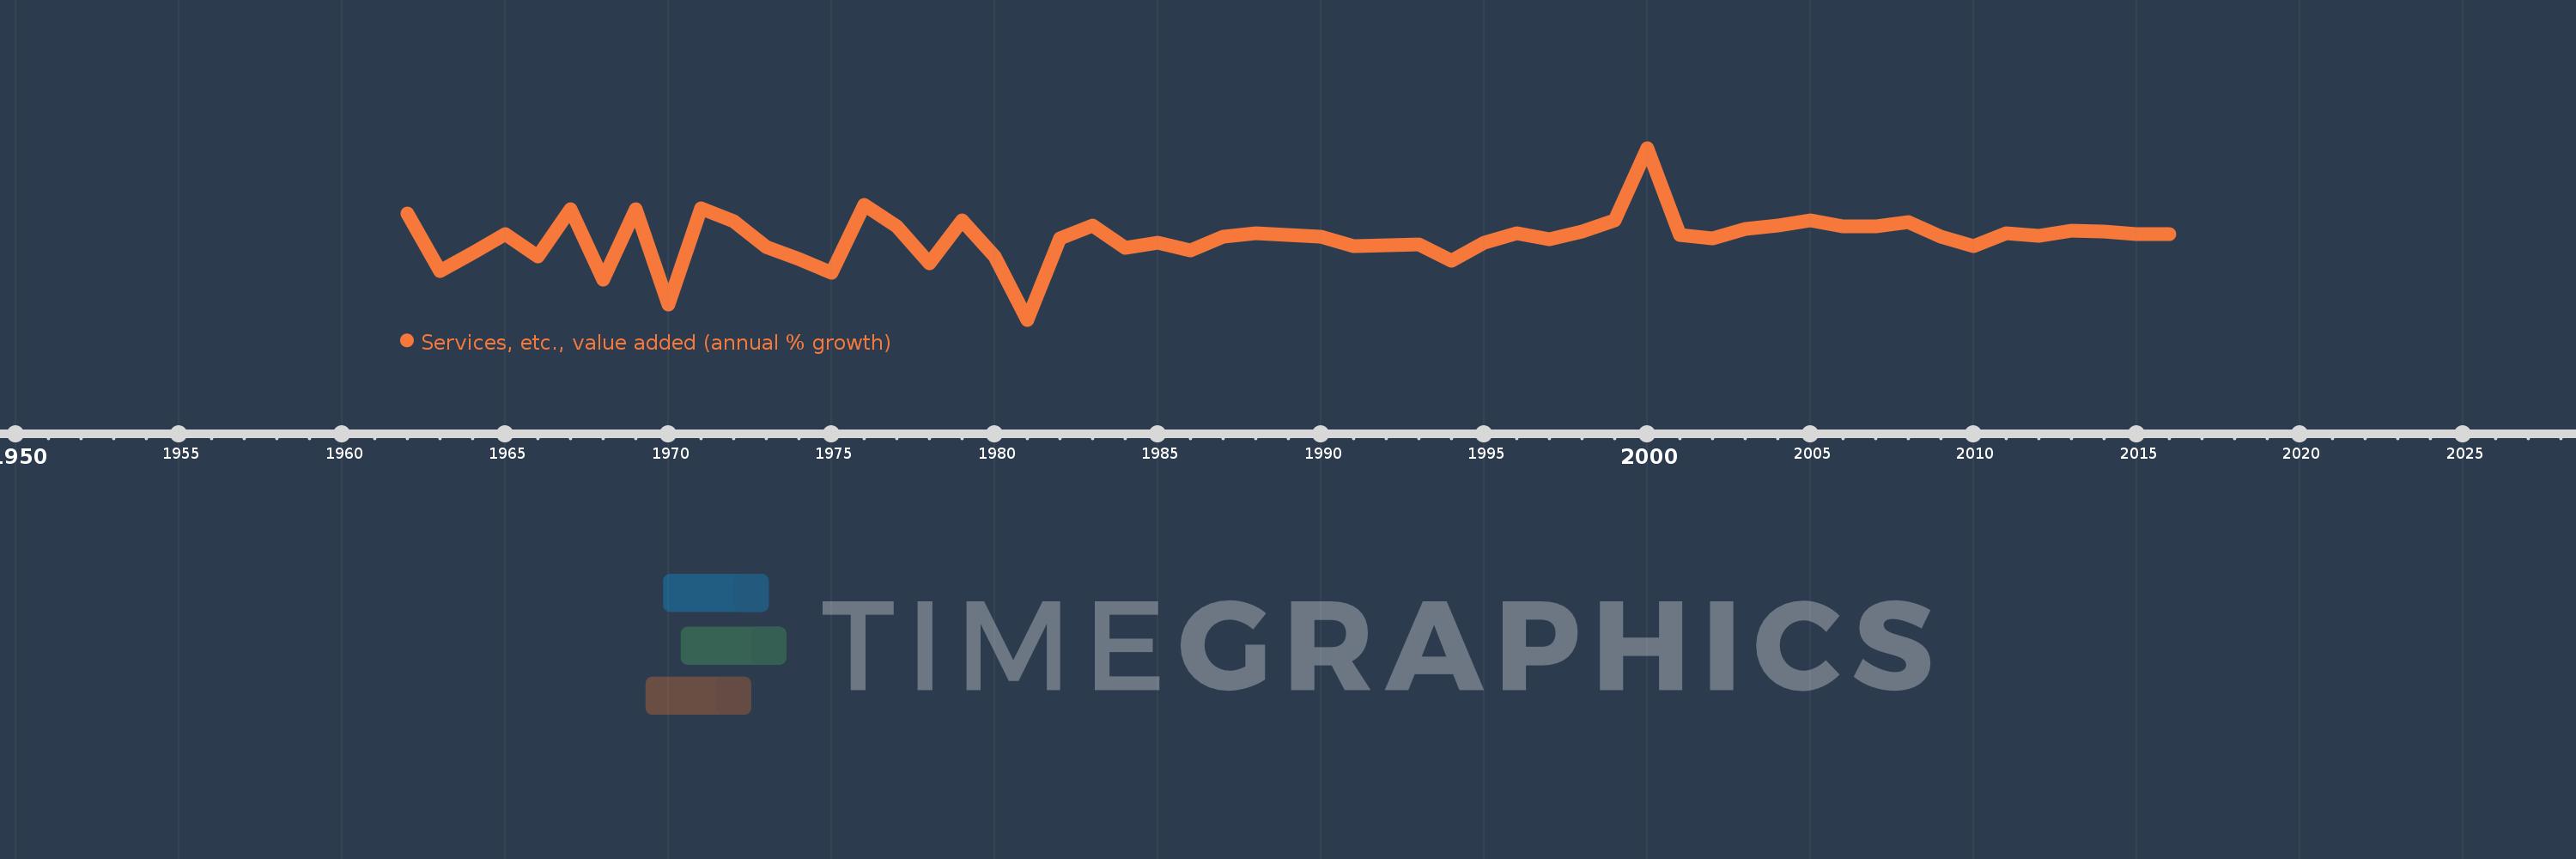
This timeline shows a graph from 1962 to 2016 of Senegal. No data until 1961. Number of actual observations by date: 55.
Source name:
World Development Indicators
Source organization:
World Bank national accounts data, and OECD National Accounts data files.
Categories, topics:
Economy & Growth
Last updated:
apr 23, 2017
Indicators value changes by year
Minimum:
-15.493
jan 1, 1981
Maximum:
23.568
jan 1, 2000
At the date of observation
Value
Absolute change
Change from previous value
jan 1, 1962
8.737
+8.737
0.0%
jan 1, 1963
-4.397
-13.134
-150.33%
jan 1, 1964
-0.398
+3.999
-90.96%
jan 1, 1965
3.909
+4.306
-1.08K%
jan 1, 1966
-1.127
-5.035
-128.83%
jan 1, 1967
9.613
+10.74
-953.21%
jan 1, 1968
-6.435
-16.048
-166.94%
jan 1, 1969
9.55
+15.985
-248.41%
jan 1, 1970
-12.036
-21.586
-226.03%
jan 1, 1971
9.931
+21.967
-182.51%
jan 1, 1972
6.956
-2.975
-29.95%
jan 1, 1973
0.954
-6.002
-86.29%
jan 1, 1974
-1.666
-2.62
-274.7%
jan 1, 1975
-4.822
-3.155
189.36%
jan 1, 1976
10.573
+15.394
-319.27%
jan 1, 1977
5.777
-4.796
-45.36%
jan 1, 1978
-2.621
-8.398
-145.37%
jan 1, 1979
7.107
+9.728
-371.18%
jan 1, 1980
-1.017
-8.124
-114.31%
jan 1, 1981
-15.493
-14.475
1.42K%
jan 1, 1982
3.039
+18.531
-119.62%
jan 1, 1983
5.868
+2.829
93.08%
jan 1, 1984
0.801
-5.067
-86.35%
jan 1, 1985
2.054
+1.253
156.42%
jan 1, 1986
0.265
-1.788
-87.08%
jan 1, 1987
3.464
+3.199
1.21K%
jan 1, 1988
4.243
+0.779
22.48%
jan 1, 1989
3.876
-0.366
-8.64%
jan 1, 1990
3.392
-0.485
-12.5%
jan 1, 1991
1.172
-2.22
-65.45%
jan 1, 1992
1.482
+0.31
26.44%
jan 1, 1993
1.553
+0.071
4.82%
jan 1, 1994
-2.155
-3.708
-238.79%
jan 1, 1995
2.002
+4.157
-192.87%
jan 1, 1996
4.15
+2.148
107.29%
jan 1, 1997
2.752
-1.398
-33.69%
jan 1, 1998
4.654
+1.902
69.12%
jan 1, 1999
7.057
+2.403
51.64%
jan 1, 2000
23.568
+16.511
233.96%
jan 1, 2001
3.802
-19.765
-83.87%
jan 1, 2002
3.018
-0.784
-20.63%
jan 1, 2003
5.059
+2.04
67.61%
jan 1, 2004
5.962
+0.904
17.86%
jan 1, 2005
7.18
+1.218
20.43%
jan 1, 2006
5.763
-1.418
-19.74%
jan 1, 2007
5.775
+0.012
0.22%
jan 1, 2008
6.758
+0.983
17.01%
jan 1, 2009
3.363
-3.395
-50.23%
jan 1, 2010
1.157
-2.206
-65.6%
jan 1, 2011
4.096
+2.939
254.01%
jan 1, 2012
3.556
-0.539
-13.16%
jan 1, 2013
4.697
+1.14
32.06%
jan 1, 2014
4.576
-0.12
-2.56%
jan 1, 2015
4.063
-0.513
-11.21%
jan 1, 2016
3.907
-0.157
-3.86%
Ranking of countries by current statistics by years


Comments: