29
/
en
AIzaSyAYiBZKx7MnpbEhh9jyipgxe19OcubqV5w
April 1, 2024
280400
Vanuatu
VUT
true
2
1
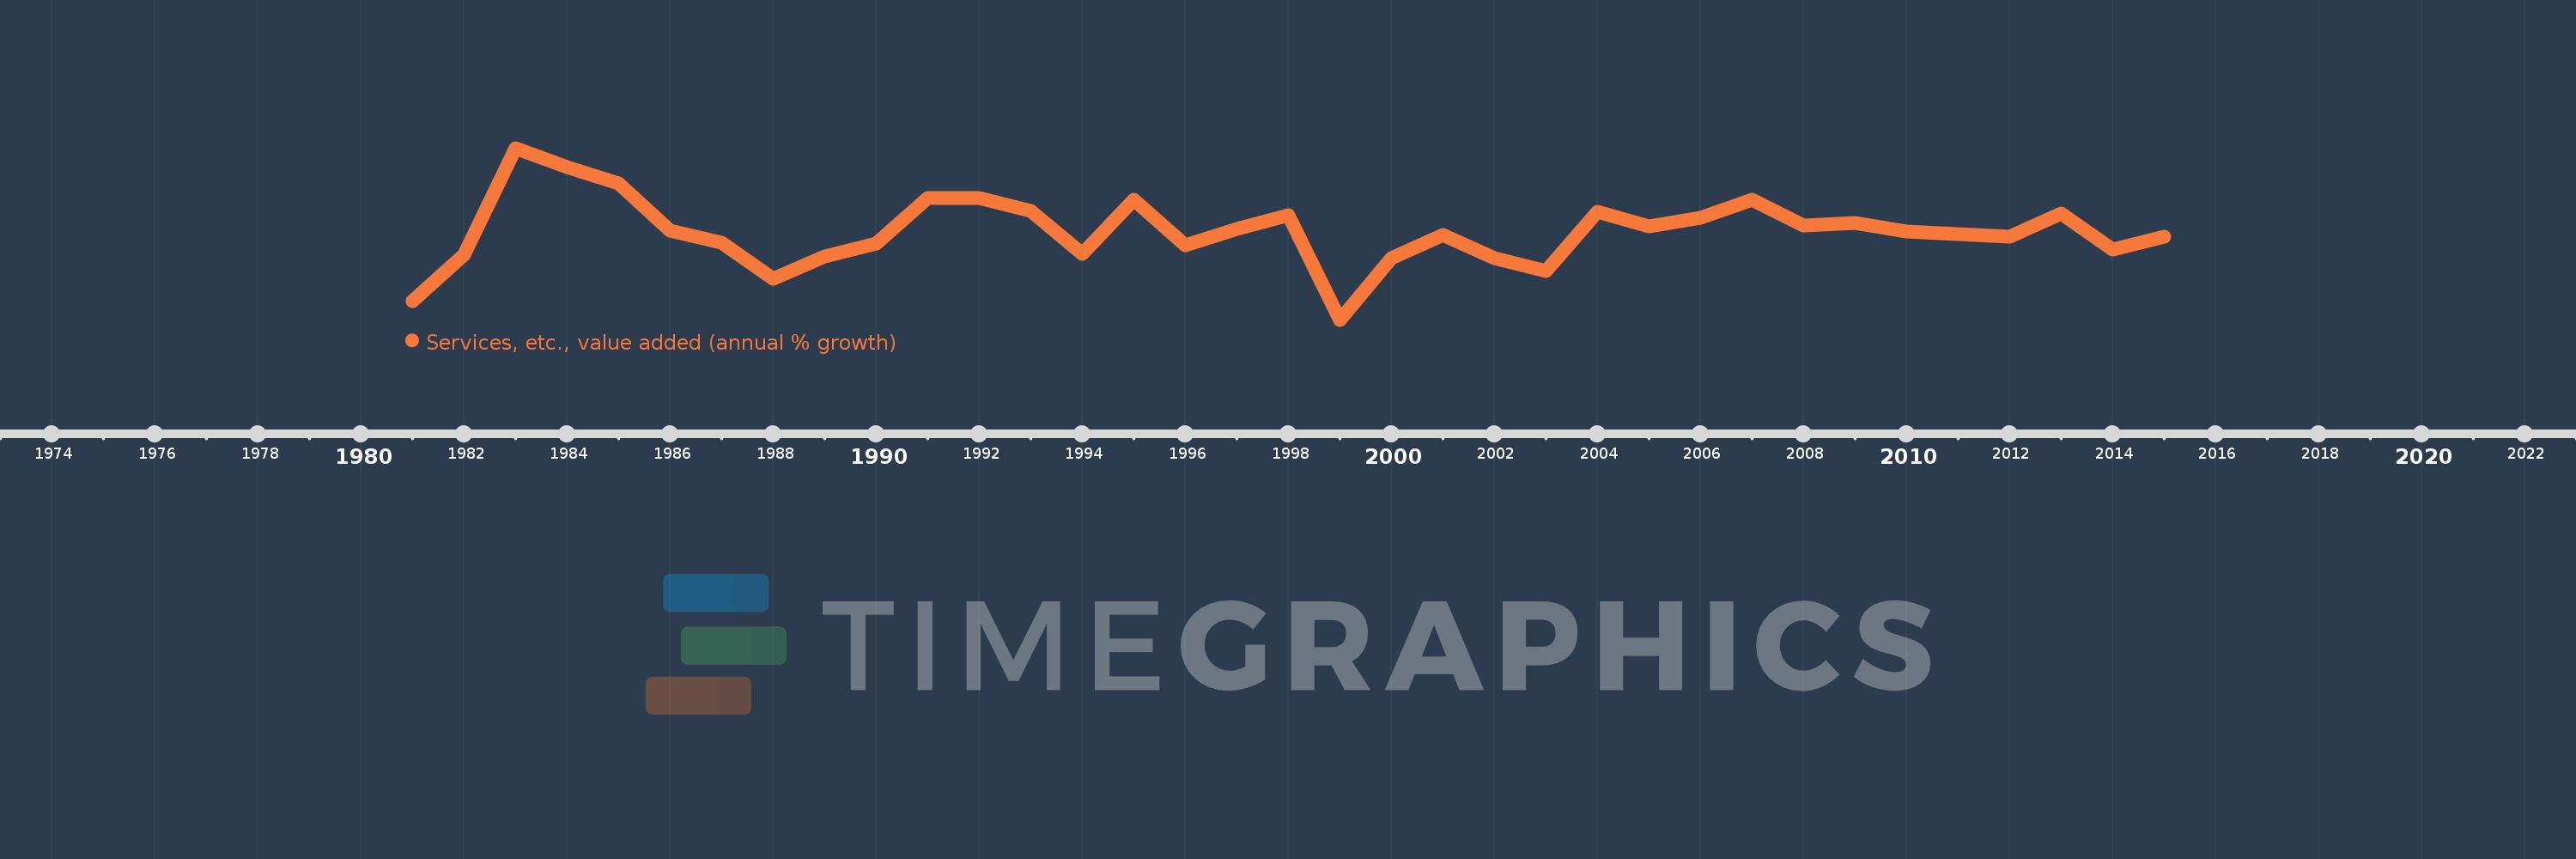
Services, etc., value added (annual % growth)
2015,2014,2013,2012,2011,2010,2009,2008,2007,2006,2005,2004,2003,2002,2001,2000,1999,1998,1997,1996,1995,1994,1993,1992,1991,1990,1989,1988,1987,1986,1985,1984,1983,1982,1981
This statistics in other country:
AfghanistanAlbaniaAlgeriaAntigua and BarbudaArab WorldArgentinaArmeniaAustraliaAustriaAzerbaijanBahamas, TheBahrainBangladeshBelarusBelgiumBelizeBeninBermudaBhutanBoliviaBosnia and HerzegovinaBotswanaBrazilBrunei DarussalamBulgariaBurkina FasoBurundiCabo VerdeCambodiaCameroonCanadaCaribbean small statesCentral African RepublicCentral Europe and the BalticsChadChileChinaColombiaComorosCongo, Dem. Rep.Congo, Rep.Costa RicaCote d'IvoireCroatiaCubaCyprusCzech RepublicDenmarkDjiboutiDominicaDominican RepublicEarly-demographic dividendEast Asia & PacificEast Asia & Pacific (excluding high income)East Asia & Pacific (IDA & IBRD countries)EcuadorEgypt, Arab Rep.El SalvadorEquatorial GuineaEritreaEstoniaEthiopiaEuro areaEurope & Central AsiaEurope & Central Asia (excluding high income)Europe & Central Asia (IDA & IBRD countries)European UnionFijiFinlandFragile and conflict affected situationsFranceGabonGambia, TheGeorgiaGermanyGhanaGreeceGrenadaGuatemalaGuineaGuinea-BissauGuyanaHaitiHeavily indebted poor countries (HIPC)High incomeHondurasHong Kong SAR, ChinaHungaryIBRD onlyIcelandIDA & IBRD totalIDA blendIDA onlyIDA totalIndiaIndonesiaIran, Islamic Rep.IraqIrelandItalyJamaicaJapanJordanKazakhstanKenyaKiribatiKorea, Rep.KosovoKuwaitKyrgyz RepublicLao PDRLate-demographic dividendLatin America & Caribbean Latin America & Caribbean (excluding high income)Latin America & the Caribbean (IDA & IBRD countries)LatviaLeast developed countries: UN classificationLebanonLesothoLiberiaLithuaniaLow & middle incomeLow incomeLower middle incomeLuxembourgMacedonia, FYRMadagascarMalawiMalaysiaMaldivesMaliMarshall IslandsMauritaniaMauritiusMexicoMicronesia, Fed. Sts.Middle East & North AfricaMiddle East & North Africa (excluding high income)Middle East & North Africa (IDA & IBRD countries)Middle incomeMoldovaMongoliaMontenegroMoroccoMozambiqueMyanmarNamibiaNepalNetherlandsNew ZealandNicaraguaNigerNigeriaNorth AmericaNorwayOECD membersOmanOther small statesPacific island small statesPakistanPalauPanamaPapua New GuineaParaguayPeruPhilippinesPolandPortugalPost-demographic dividendPre-demographic dividendPuerto RicoQatarRomaniaRussian FederationRwandaSamoaSao Tome and PrincipeSaudi ArabiaSenegalSerbiaSeychellesSierra LeoneSingaporeSlovak RepublicSloveniaSmall statesSolomon IslandsSomaliaSouth AfricaSouth AsiaSouth Asia (IDA & IBRD)SpainSri LankaSt. Kitts and NevisSt. LuciaSt. Vincent and the GrenadinesSub-Saharan Africa Sub-Saharan Africa (excluding high income)Sub-Saharan Africa (IDA & IBRD countries)SudanSurinameSwazilandSwedenSwitzerlandSyrian Arab RepublicTajikistanTanzaniaThailandTimor-LesteTogoTongaTrinidad and TobagoTunisiaTurkeyTurkmenistanTuvaluUgandaUkraineUnited Arab EmiratesUnited KingdomUnited StatesUpper middle incomeUruguayUzbekistanVanuatuVenezuela, RBVietnamWest Bank and GazaWorldZambiaZimbabwe Timeline:
This timeline shows a graph from 1981 to 2015 of Vanuatu. No data until 1980. Number of actual observations by date: 35.
Source name:
World Development Indicators
Source organization:
World Bank national accounts data, and OECD National Accounts data files.
Categories, topics:
Economy & Growth
Last updated:
apr 23, 2017
Indicators value changes by year
Minimum:
-12.85
jan 1, 1999
Maximum:
18.493
jan 1, 1983
At the date of observation
Value
Absolute change
Change from previous value
jan 1, 1981
-9.47
-9.47
0.0%
jan 1, 1982
-0.912
+8.558
-90.37%
jan 1, 1983
18.493
+19.405
-2.13K%
jan 1, 1984
14.98
-3.513
-19.0%
jan 1, 1985
11.986
-2.994
-19.99%
jan 1, 1986
3.433
-8.552
-71.35%
jan 1, 1987
1.132
-2.301
-67.03%
jan 1, 1988
-5.326
-6.458
-570.55%
jan 1, 1989
-1.266
+4.06
-76.23%
jan 1, 1990
1.107
+2.373
-187.46%
jan 1, 1991
9.329
+8.222
742.57%
jan 1, 1992
9.301
-0.028
-0.3%
jan 1, 1993
6.937
-2.364
-25.41%
jan 1, 1994
-0.775
-7.713
-111.18%
jan 1, 1995
9.056
+9.831
-1.27K%
jan 1, 1996
0.694
-8.362
-92.34%
jan 1, 1997
3.688
+2.994
431.39%
jan 1, 1998
6.23
+2.542
68.91%
jan 1, 1999
-12.85
-19.08
-306.26%
jan 1, 2000
-1.581
+11.269
-87.7%
jan 1, 2001
2.619
+4.2
-265.69%
jan 1, 2002
-1.607
-4.226
-161.37%
jan 1, 2003
-4.017
-2.41
149.95%
jan 1, 2004
6.852
+10.869
-270.57%
jan 1, 2005
4.172
-2.68
-39.11%
jan 1, 2006
5.718
+1.546
37.07%
jan 1, 2007
9.072
+3.354
58.65%
jan 1, 2008
4.277
-4.795
-52.85%
jan 1, 2009
4.736
+0.459
10.72%
jan 1, 2010
3.18
-1.556
-32.85%
jan 1, 2011
2.813
-0.367
-11.53%
jan 1, 2012
2.259
-0.555
-19.71%
jan 1, 2013
6.606
+4.347
192.46%
jan 1, 2014
-0.017
-6.623
-100.25%
jan 1, 2015
2.367
+2.384
-14.42K%
Ranking of countries by current statistics by years


Comments: