29
/
en
AIzaSyAYiBZKx7MnpbEhh9jyipgxe19OcubqV5w
April 1, 2024
59364
Sub-Saharan Africa
SSF
false
2
1
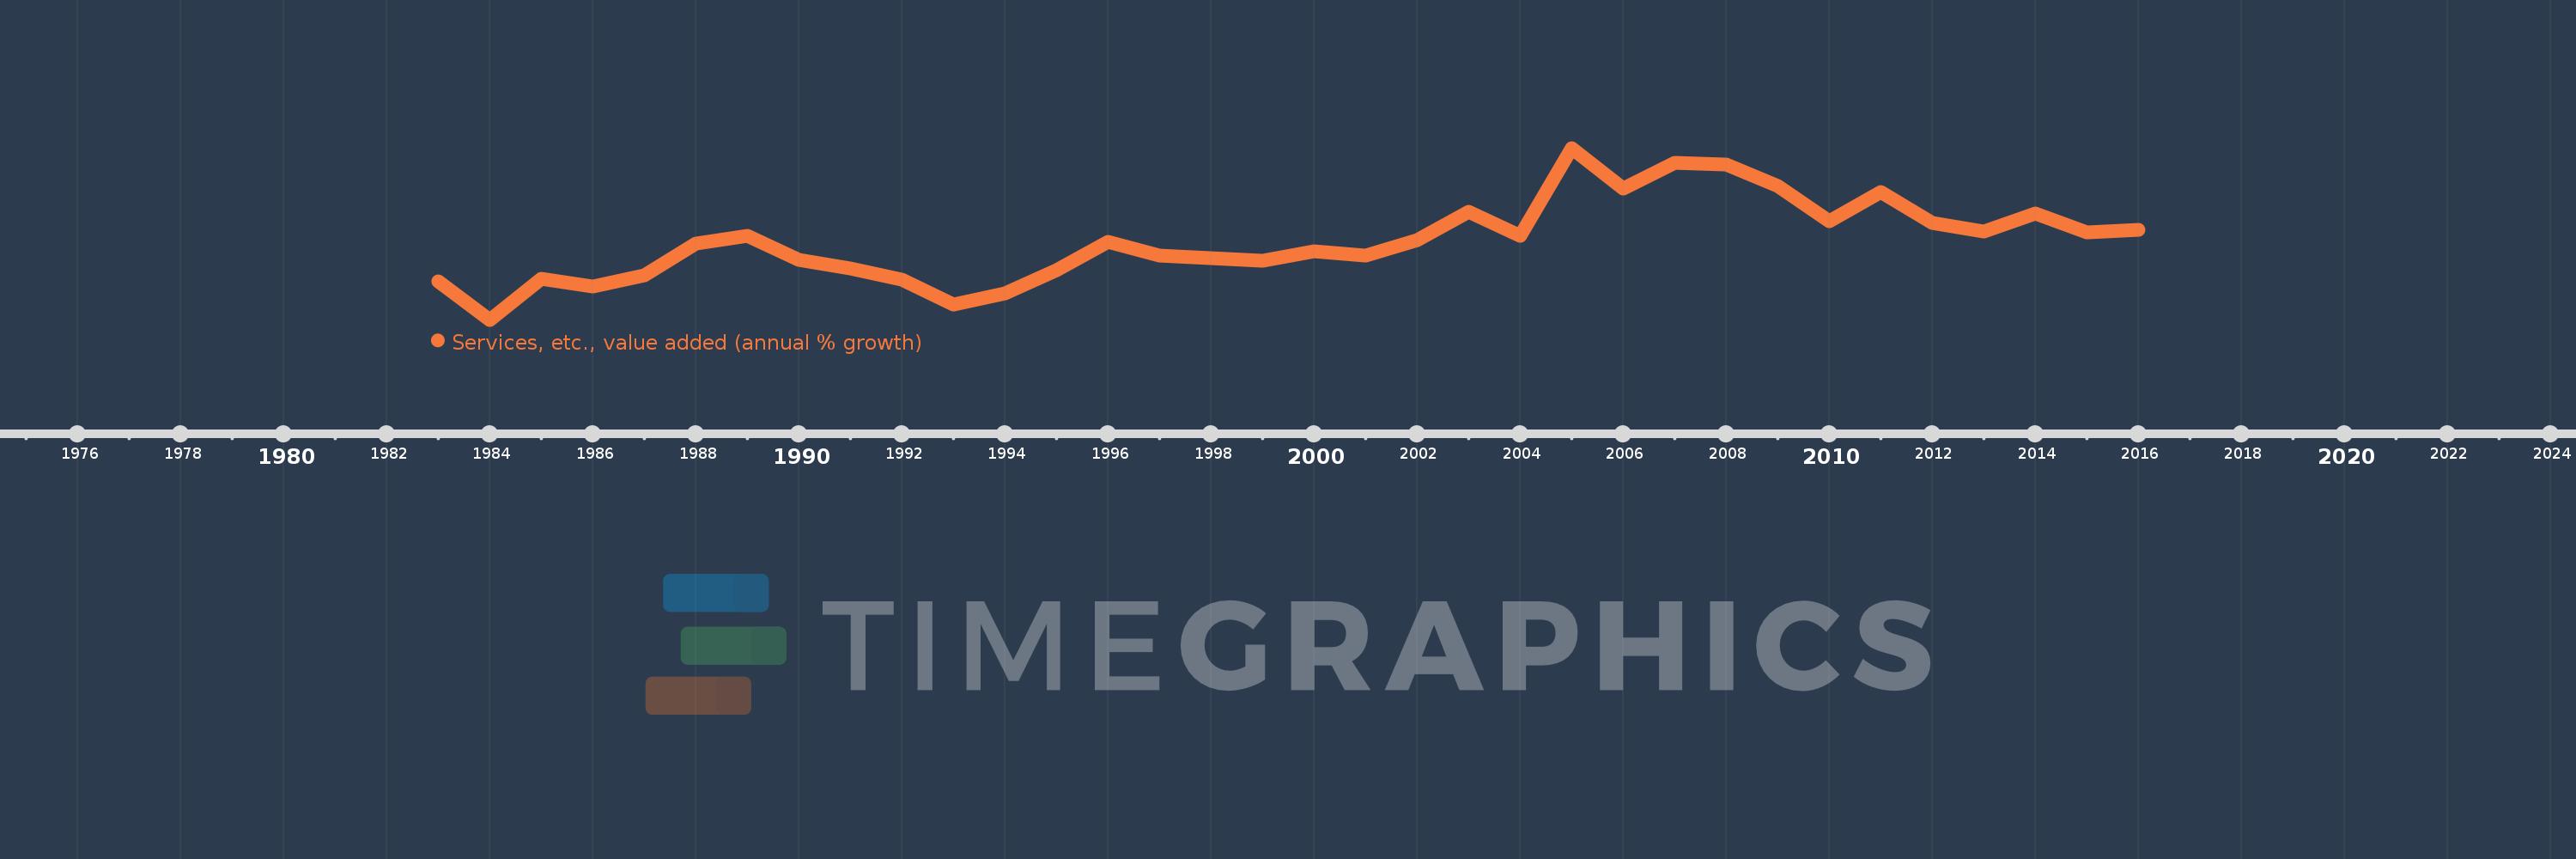
Services, etc., value added (annual % growth)
2016,2015,2014,2013,2012,2011,2010,2009,2008,2007,2006,2005,2004,2003,2002,2001,2000,1999,1998,1997,1996,1995,1994,1993,1992,1991,1990,1989,1988,1987,1986,1985,1984,1983
This statistics in other country:
AfghanistanAlbaniaAlgeriaAntigua and BarbudaArab WorldArgentinaArmeniaAustraliaAustriaAzerbaijanBahamas, TheBahrainBangladeshBelarusBelgiumBelizeBeninBermudaBhutanBoliviaBosnia and HerzegovinaBotswanaBrazilBrunei DarussalamBulgariaBurkina FasoBurundiCabo VerdeCambodiaCameroonCanadaCaribbean small statesCentral African RepublicCentral Europe and the BalticsChadChileChinaColombiaComorosCongo, Dem. Rep.Congo, Rep.Costa RicaCote d'IvoireCroatiaCubaCyprusCzech RepublicDenmarkDjiboutiDominicaDominican RepublicEarly-demographic dividendEast Asia & PacificEast Asia & Pacific (excluding high income)East Asia & Pacific (IDA & IBRD countries)EcuadorEgypt, Arab Rep.El SalvadorEquatorial GuineaEritreaEstoniaEthiopiaEuro areaEurope & Central AsiaEurope & Central Asia (excluding high income)Europe & Central Asia (IDA & IBRD countries)European UnionFijiFinlandFragile and conflict affected situationsFranceGabonGambia, TheGeorgiaGermanyGhanaGreeceGrenadaGuatemalaGuineaGuinea-BissauGuyanaHaitiHeavily indebted poor countries (HIPC)High incomeHondurasHong Kong SAR, ChinaHungaryIBRD onlyIcelandIDA & IBRD totalIDA blendIDA onlyIDA totalIndiaIndonesiaIran, Islamic Rep.IraqIrelandItalyJamaicaJapanJordanKazakhstanKenyaKiribatiKorea, Rep.KosovoKuwaitKyrgyz RepublicLao PDRLate-demographic dividendLatin America & Caribbean Latin America & Caribbean (excluding high income)Latin America & the Caribbean (IDA & IBRD countries)LatviaLeast developed countries: UN classificationLebanonLesothoLiberiaLithuaniaLow & middle incomeLow incomeLower middle incomeLuxembourgMacedonia, FYRMadagascarMalawiMalaysiaMaldivesMaliMarshall IslandsMauritaniaMauritiusMexicoMicronesia, Fed. Sts.Middle East & North AfricaMiddle East & North Africa (excluding high income)Middle East & North Africa (IDA & IBRD countries)Middle incomeMoldovaMongoliaMontenegroMoroccoMozambiqueMyanmarNamibiaNepalNetherlandsNew ZealandNicaraguaNigerNigeriaNorth AmericaNorwayOECD membersOmanOther small statesPacific island small statesPakistanPalauPanamaPapua New GuineaParaguayPeruPhilippinesPolandPortugalPost-demographic dividendPre-demographic dividendPuerto RicoQatarRomaniaRussian FederationRwandaSamoaSao Tome and PrincipeSaudi ArabiaSenegalSerbiaSeychellesSierra LeoneSingaporeSlovak RepublicSloveniaSmall statesSolomon IslandsSomaliaSouth AfricaSouth AsiaSouth Asia (IDA & IBRD)SpainSri LankaSt. Kitts and NevisSt. LuciaSt. Vincent and the GrenadinesSub-Saharan Africa Sub-Saharan Africa (excluding high income)Sub-Saharan Africa (IDA & IBRD countries)SudanSurinameSwazilandSwedenSwitzerlandSyrian Arab RepublicTajikistanTanzaniaThailandTimor-LesteTogoTongaTrinidad and TobagoTunisiaTurkeyTurkmenistanTuvaluUgandaUkraineUnited Arab EmiratesUnited KingdomUnited StatesUpper middle incomeUruguayUzbekistanVanuatuVenezuela, RBVietnamWest Bank and GazaWorldZambiaZimbabwe Timeline:
This timeline shows a graph from 1983 to 2016 of Sub-Saharan Africa . No data until 1982. Number of actual observations by date: 34.
Source name:
World Development Indicators
Source organization:
World Bank national accounts data, and OECD National Accounts data files.
Categories, topics:
Economy & Growth
Last updated:
apr 23, 2017
Indicators value changes by year
Minimum:
-0.847
jan 1, 1984
At the date of observation
Value
Absolute change
Change from previous value
jan 1, 1983
1.52
+1.52
0.0%
jan 1, 1984
-0.847
-2.367
-155.69%
jan 1, 1985
1.661
+2.508
-296.22%
jan 1, 1986
1.183
-0.478
-28.76%
jan 1, 1987
1.888
+0.704
59.51%
jan 1, 1988
3.818
+1.93
102.24%
jan 1, 1989
4.308
+0.49
12.85%
jan 1, 1990
2.808
-1.5
-34.83%
jan 1, 1991
2.311
-0.497
-17.71%
jan 1, 1992
1.605
-0.705
-30.52%
jan 1, 1993
0.073
-1.533
-95.47%
jan 1, 1994
0.778
+0.706
970.45%
jan 1, 1995
2.186
+1.408
180.86%
jan 1, 1996
3.905
+1.719
78.65%
jan 1, 1997
3.08
-0.825
-21.12%
jan 1, 1998
2.922
-0.158
-5.14%
jan 1, 1999
2.745
-0.176
-6.04%
jan 1, 2000
3.348
+0.603
21.97%
jan 1, 2001
3.059
-0.29
-8.65%
jan 1, 2002
4.032
+0.973
31.81%
jan 1, 2003
5.745
+1.713
42.49%
jan 1, 2004
4.285
-1.46
-25.42%
jan 1, 2005
9.663
+5.378
125.52%
jan 1, 2006
7.152
-2.51
-25.98%
jan 1, 2007
8.772
+1.62
22.65%
jan 1, 2008
8.647
-0.125
-1.43%
jan 1, 2009
7.36
-1.287
-14.88%
jan 1, 2010
5.16
-2.2
-29.89%
jan 1, 2011
6.951
+1.791
34.72%
jan 1, 2012
5.057
-1.894
-27.25%
jan 1, 2013
4.56
-0.497
-9.84%
jan 1, 2014
5.664
+1.104
24.21%
jan 1, 2015
4.523
-1.141
-20.14%
jan 1, 2016
4.67
+0.148
3.26%
Ranking of countries by current statistics by years


Comments: