29
/
en
AIzaSyAYiBZKx7MnpbEhh9jyipgxe19OcubqV5w
April 1, 2024
111625
Congo, Rep.
COG
true
2
1
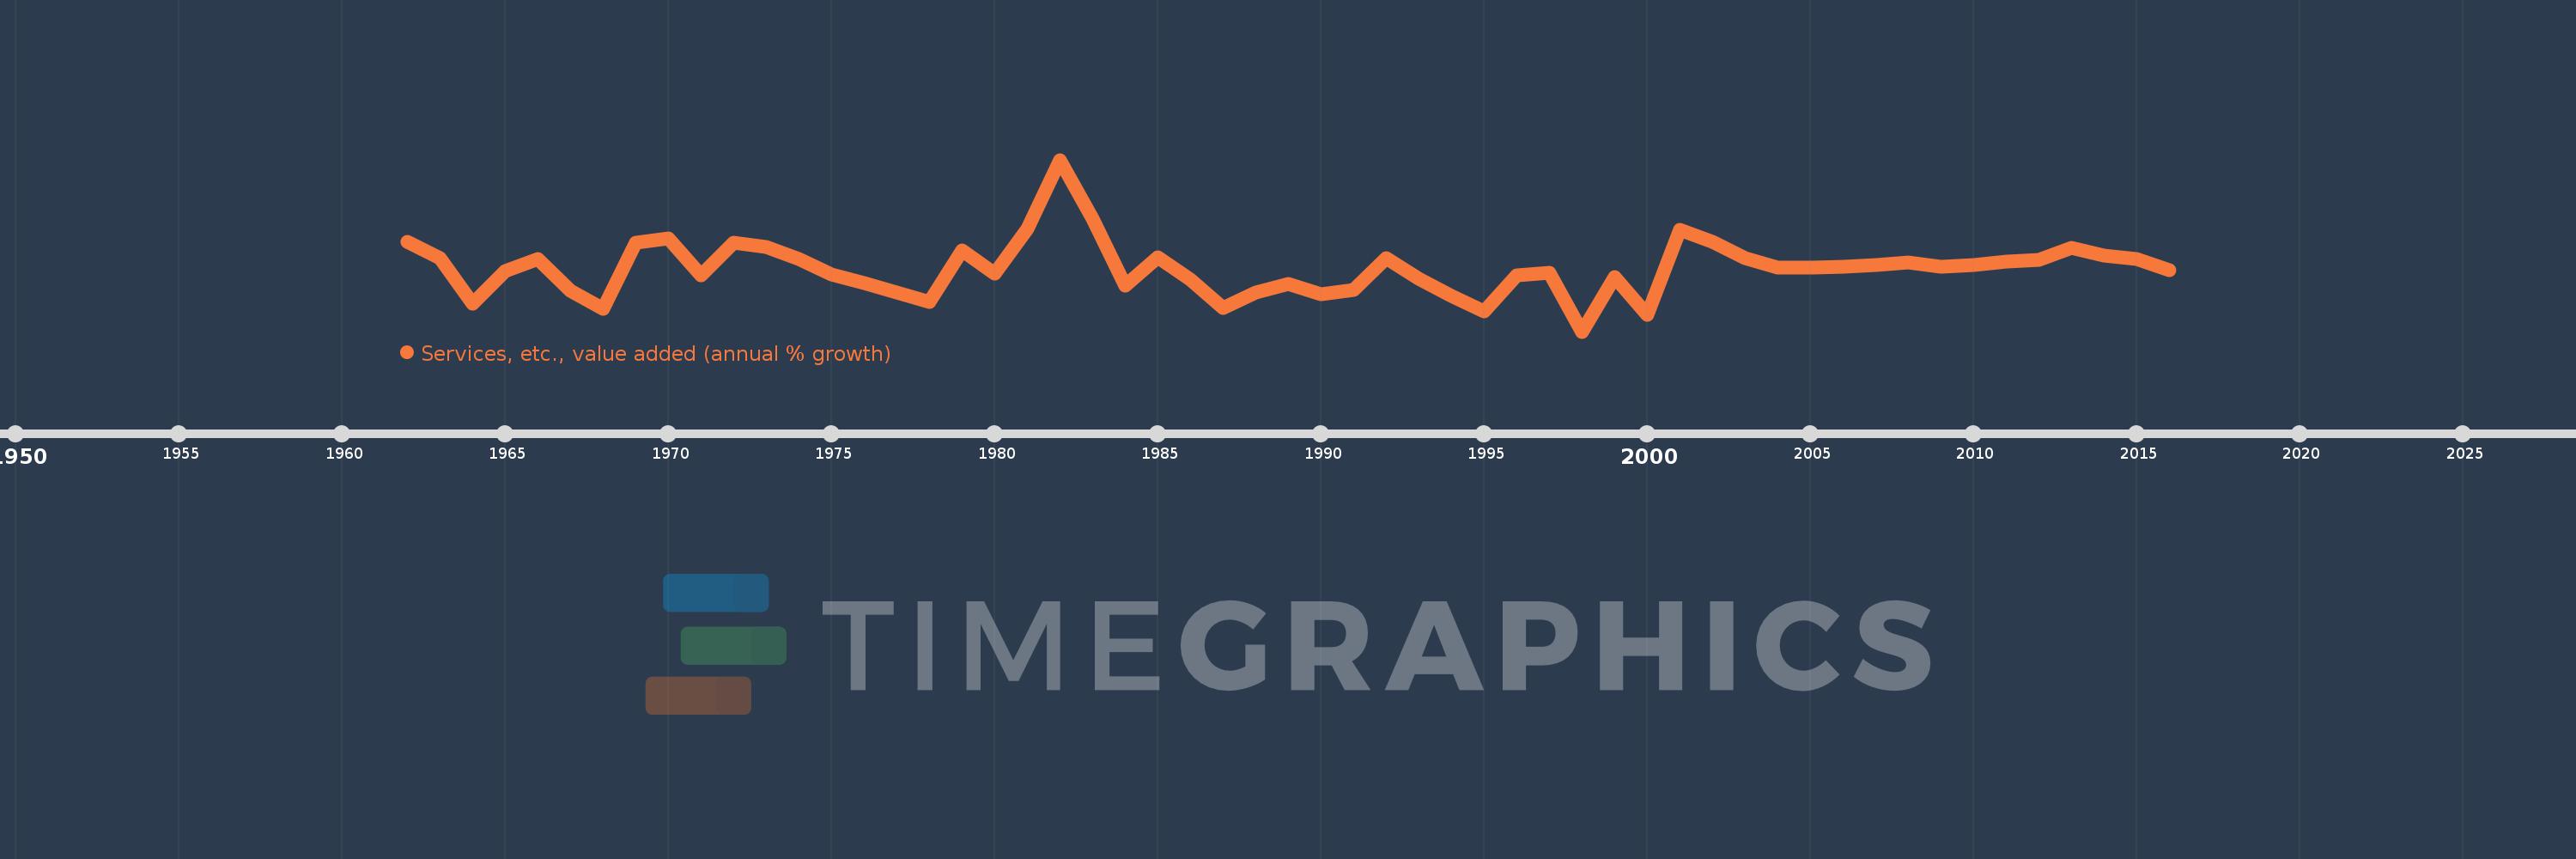
Services, etc., value added (annual % growth)
2016,2015,2014,2013,2012,2011,2010,2009,2008,2007,2006,2005,2004,2003,2002,2001,2000,1999,1998,1997,1996,1995,1994,1993,1992,1991,1990,1989,1988,1987,1986,1985,1984,1983,1982,1981,1980,1979,1978,1977,1976,1975,1974,1973,1972,1971,1970,1969,1968,1967,1966,1965,1964,1963,1962
This statistics in other country:
AfghanistanAlbaniaAlgeriaAntigua and BarbudaArab WorldArgentinaArmeniaAustraliaAustriaAzerbaijanBahamas, TheBahrainBangladeshBelarusBelgiumBelizeBeninBermudaBhutanBoliviaBosnia and HerzegovinaBotswanaBrazilBrunei DarussalamBulgariaBurkina FasoBurundiCabo VerdeCambodiaCameroonCanadaCaribbean small statesCentral African RepublicCentral Europe and the BalticsChadChileChinaColombiaComorosCongo, Dem. Rep.Congo, Rep.Costa RicaCote d'IvoireCroatiaCubaCyprusCzech RepublicDenmarkDjiboutiDominicaDominican RepublicEarly-demographic dividendEast Asia & PacificEast Asia & Pacific (excluding high income)East Asia & Pacific (IDA & IBRD countries)EcuadorEgypt, Arab Rep.El SalvadorEquatorial GuineaEritreaEstoniaEthiopiaEuro areaEurope & Central AsiaEurope & Central Asia (excluding high income)Europe & Central Asia (IDA & IBRD countries)European UnionFijiFinlandFragile and conflict affected situationsFranceGabonGambia, TheGeorgiaGermanyGhanaGreeceGrenadaGuatemalaGuineaGuinea-BissauGuyanaHaitiHeavily indebted poor countries (HIPC)High incomeHondurasHong Kong SAR, ChinaHungaryIBRD onlyIcelandIDA & IBRD totalIDA blendIDA onlyIDA totalIndiaIndonesiaIran, Islamic Rep.IraqIrelandItalyJamaicaJapanJordanKazakhstanKenyaKiribatiKorea, Rep.KosovoKuwaitKyrgyz RepublicLao PDRLate-demographic dividendLatin America & Caribbean Latin America & Caribbean (excluding high income)Latin America & the Caribbean (IDA & IBRD countries)LatviaLeast developed countries: UN classificationLebanonLesothoLiberiaLithuaniaLow & middle incomeLow incomeLower middle incomeLuxembourgMacedonia, FYRMadagascarMalawiMalaysiaMaldivesMaliMarshall IslandsMauritaniaMauritiusMexicoMicronesia, Fed. Sts.Middle East & North AfricaMiddle East & North Africa (excluding high income)Middle East & North Africa (IDA & IBRD countries)Middle incomeMoldovaMongoliaMontenegroMoroccoMozambiqueMyanmarNamibiaNepalNetherlandsNew ZealandNicaraguaNigerNigeriaNorth AmericaNorwayOECD membersOmanOther small statesPacific island small statesPakistanPalauPanamaPapua New GuineaParaguayPeruPhilippinesPolandPortugalPost-demographic dividendPre-demographic dividendPuerto RicoQatarRomaniaRussian FederationRwandaSamoaSao Tome and PrincipeSaudi ArabiaSenegalSerbiaSeychellesSierra LeoneSingaporeSlovak RepublicSloveniaSmall statesSolomon IslandsSomaliaSouth AfricaSouth AsiaSouth Asia (IDA & IBRD)SpainSri LankaSt. Kitts and NevisSt. LuciaSt. Vincent and the GrenadinesSub-Saharan Africa Sub-Saharan Africa (excluding high income)Sub-Saharan Africa (IDA & IBRD countries)SudanSurinameSwazilandSwedenSwitzerlandSyrian Arab RepublicTajikistanTanzaniaThailandTimor-LesteTogoTongaTrinidad and TobagoTunisiaTurkeyTurkmenistanTuvaluUgandaUkraineUnited Arab EmiratesUnited KingdomUnited StatesUpper middle incomeUruguayUzbekistanVanuatuVenezuela, RBVietnamWest Bank and GazaWorldZambiaZimbabwe Timeline:
This timeline shows a graph from 1962 to 2016 of Congo, Rep.. No data until 1961. Number of actual observations by date: 55.
Source name:
World Development Indicators
Source organization:
World Bank national accounts data, and OECD National Accounts data files.
Categories, topics:
Economy & Growth
Last updated:
apr 23, 2017
Indicators value changes by year
Minimum:
-14.186
jan 1, 1998
Maximum:
36.448
jan 1, 1982
At the date of observation
Value
Absolute change
Change from previous value
jan 1, 1962
12.388
+12.388
0.0%
jan 1, 1963
7.358
-5.03
-40.6%
jan 1, 1964
-6.003
-13.362
-181.59%
jan 1, 1965
3.694
+9.697
-161.53%
jan 1, 1966
7.199
+3.505
94.9%
jan 1, 1967
-2.137
-9.336
-129.69%
jan 1, 1968
-7.416
-5.279
247.01%
jan 1, 1969
12.135
+19.551
-263.64%
jan 1, 1970
13.22
+1.085
8.94%
jan 1, 1971
2.285
-10.935
-82.71%
jan 1, 1972
12.041
+9.755
426.84%
jan 1, 1973
10.815
-1.226
-10.18%
jan 1, 1974
7.288
-3.527
-32.61%
jan 1, 1975
2.534
-4.754
-65.23%
jan 1, 1976
0.173
-2.361
-93.17%
jan 1, 1977
-2.731
-2.904
-1.68K%
jan 1, 1978
-5.353
-2.623
96.05%
jan 1, 1979
9.632
+14.985
-279.92%
jan 1, 1980
2.875
-6.757
-70.15%
jan 1, 1981
16.029
+13.154
457.56%
jan 1, 1982
36.448
+20.419
127.39%
jan 1, 1983
19.102
-17.346
-47.59%
jan 1, 1984
-0.716
-19.818
-103.75%
jan 1, 1985
7.596
+8.312
-1.16K%
jan 1, 1986
1.028
-6.568
-86.47%
jan 1, 1987
-7.098
-8.125
-790.62%
jan 1, 1988
-2.628
+4.469
-62.97%
jan 1, 1989
-0.144
+2.485
-94.53%
jan 1, 1990
-3.103
-2.96
2.06K%
jan 1, 1991
-1.889
+1.214
-39.13%
jan 1, 1992
7.486
+9.375
-496.33%
jan 1, 1993
1.281
-6.205
-82.88%
jan 1, 1994
-3.671
-4.952
-386.5%
jan 1, 1995
-8.165
-4.494
122.41%
jan 1, 1996
2.342
+10.507
-128.69%
jan 1, 1997
3.152
+0.81
34.6%
jan 1, 1998
-14.186
-17.338
-550.0%
jan 1, 1999
1.812
+15.997
-112.77%
jan 1, 2000
-9.345
-11.157
-615.85%
jan 1, 2001
15.759
+25.104
-268.63%
jan 1, 2002
12.305
-3.453
-21.91%
jan 1, 2003
7.401
-4.905
-39.86%
jan 1, 2004
4.581
-2.82
-38.1%
jan 1, 2005
4.609
+0.027
0.6%
jan 1, 2006
5.048
+0.439
9.54%
jan 1, 2007
5.548
+0.5
9.91%
jan 1, 2008
6.224
+0.676
12.18%
jan 1, 2009
4.969
-1.255
-20.16%
jan 1, 2010
5.317
+0.348
7.0%
jan 1, 2011
6.535
+1.218
22.9%
jan 1, 2012
6.83
+0.295
4.52%
jan 1, 2013
10.484
+3.655
53.51%
jan 1, 2014
8.106
-2.379
-22.69%
jan 1, 2015
7.313
-0.793
-9.79%
jan 1, 2016
3.848
-3.465
-47.38%
Ranking of countries by current statistics by years


Comments: