29
/
en
AIzaSyAYiBZKx7MnpbEhh9jyipgxe19OcubqV5w
April 1, 2024
28703
East Asia & Pacific (excluding high income)
EAP
false
2
1
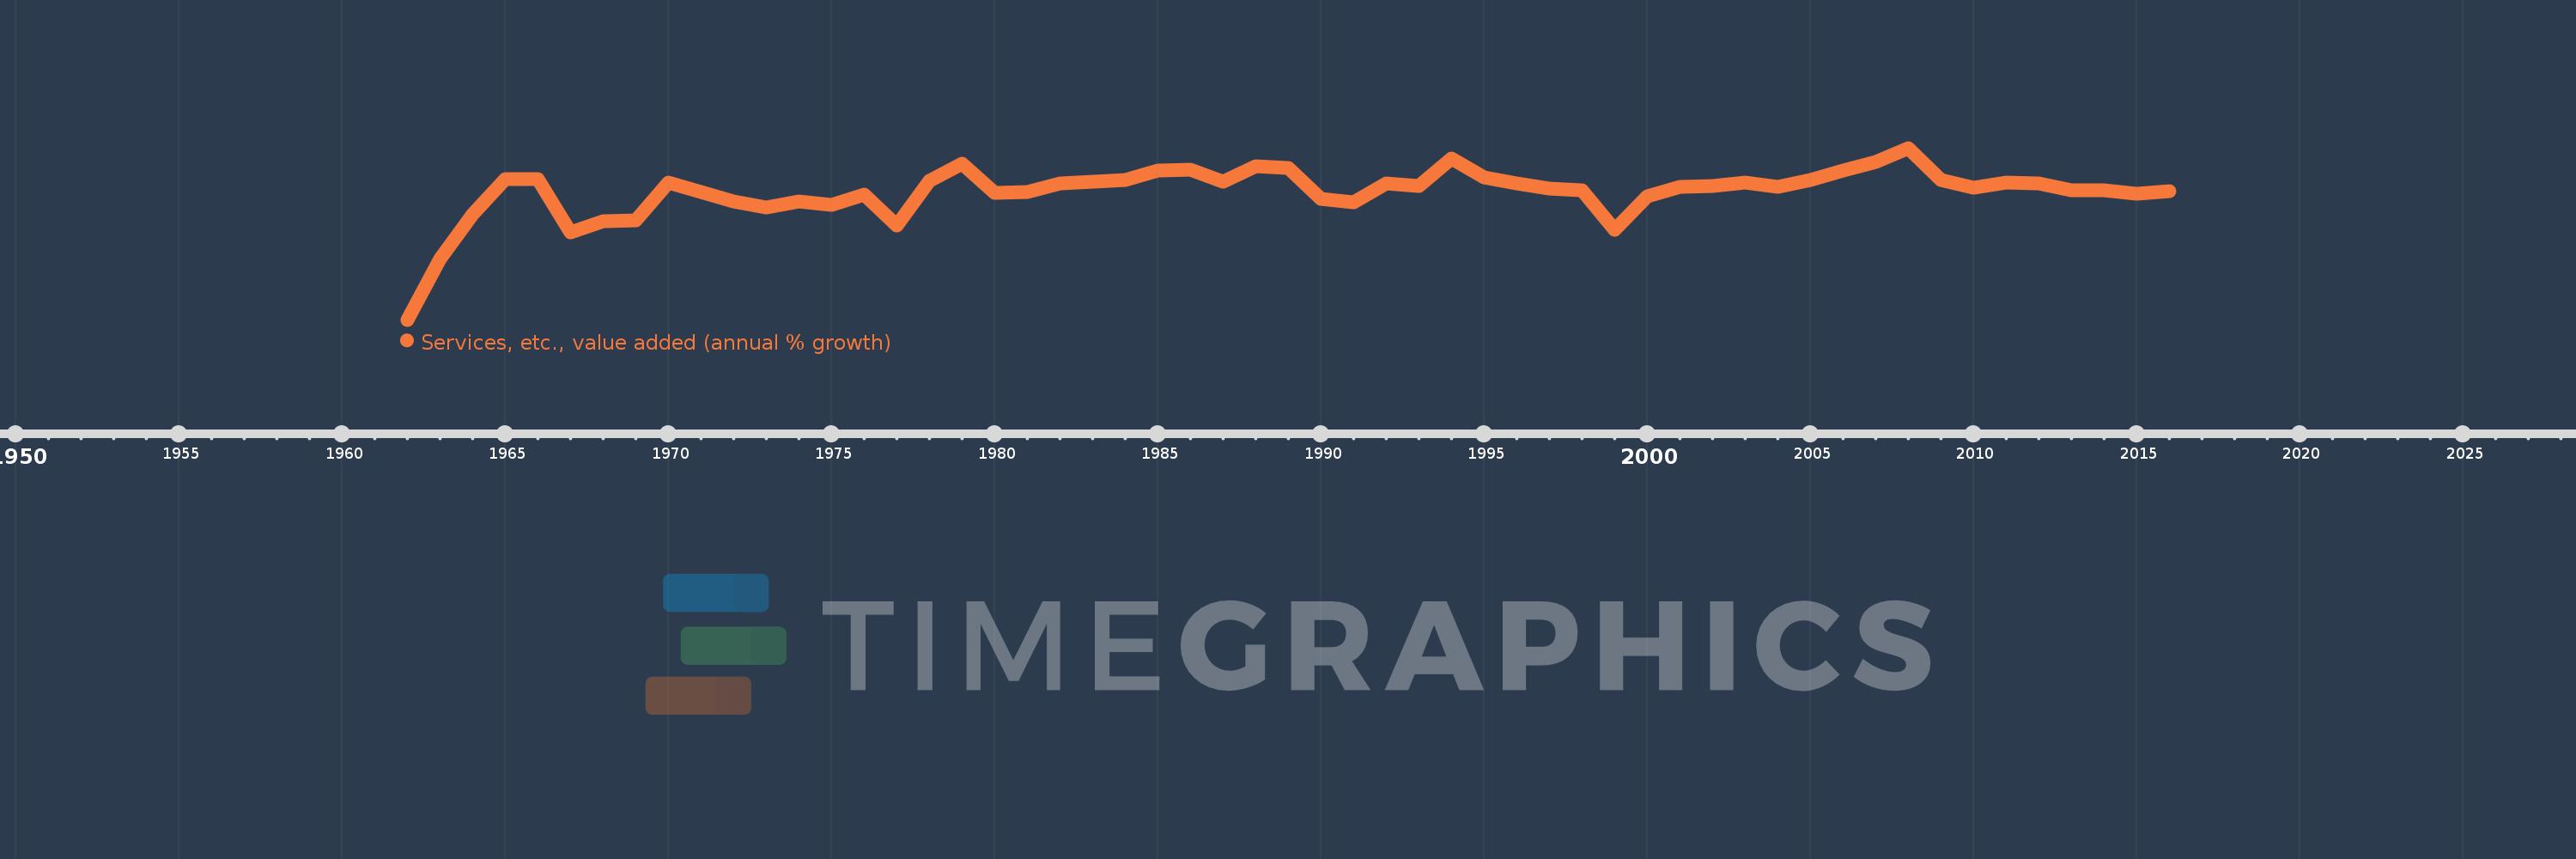
Services, etc., value added (annual % growth)
2016,2015,2014,2013,2012,2011,2010,2009,2008,2007,2006,2005,2004,2003,2002,2001,2000,1999,1998,1997,1996,1995,1994,1993,1992,1991,1990,1989,1988,1987,1986,1985,1984,1983,1982,1981,1980,1979,1978,1977,1976,1975,1974,1973,1972,1971,1970,1969,1968,1967,1966,1965,1964,1963,1962
This statistics in other country:
AfghanistanAlbaniaAlgeriaAntigua and BarbudaArab WorldArgentinaArmeniaAustraliaAustriaAzerbaijanBahamas, TheBahrainBangladeshBelarusBelgiumBelizeBeninBermudaBhutanBoliviaBosnia and HerzegovinaBotswanaBrazilBrunei DarussalamBulgariaBurkina FasoBurundiCabo VerdeCambodiaCameroonCanadaCaribbean small statesCentral African RepublicCentral Europe and the BalticsChadChileChinaColombiaComorosCongo, Dem. Rep.Congo, Rep.Costa RicaCote d'IvoireCroatiaCubaCyprusCzech RepublicDenmarkDjiboutiDominicaDominican RepublicEarly-demographic dividendEast Asia & PacificEast Asia & Pacific (excluding high income)East Asia & Pacific (IDA & IBRD countries)EcuadorEgypt, Arab Rep.El SalvadorEquatorial GuineaEritreaEstoniaEthiopiaEuro areaEurope & Central AsiaEurope & Central Asia (excluding high income)Europe & Central Asia (IDA & IBRD countries)European UnionFijiFinlandFragile and conflict affected situationsFranceGabonGambia, TheGeorgiaGermanyGhanaGreeceGrenadaGuatemalaGuineaGuinea-BissauGuyanaHaitiHeavily indebted poor countries (HIPC)High incomeHondurasHong Kong SAR, ChinaHungaryIBRD onlyIcelandIDA & IBRD totalIDA blendIDA onlyIDA totalIndiaIndonesiaIran, Islamic Rep.IraqIrelandItalyJamaicaJapanJordanKazakhstanKenyaKiribatiKorea, Rep.KosovoKuwaitKyrgyz RepublicLao PDRLate-demographic dividendLatin America & Caribbean Latin America & Caribbean (excluding high income)Latin America & the Caribbean (IDA & IBRD countries)LatviaLeast developed countries: UN classificationLebanonLesothoLiberiaLithuaniaLow & middle incomeLow incomeLower middle incomeLuxembourgMacedonia, FYRMadagascarMalawiMalaysiaMaldivesMaliMarshall IslandsMauritaniaMauritiusMexicoMicronesia, Fed. Sts.Middle East & North AfricaMiddle East & North Africa (excluding high income)Middle East & North Africa (IDA & IBRD countries)Middle incomeMoldovaMongoliaMontenegroMoroccoMozambiqueMyanmarNamibiaNepalNetherlandsNew ZealandNicaraguaNigerNigeriaNorth AmericaNorwayOECD membersOmanOther small statesPacific island small statesPakistanPalauPanamaPapua New GuineaParaguayPeruPhilippinesPolandPortugalPost-demographic dividendPre-demographic dividendPuerto RicoQatarRomaniaRussian FederationRwandaSamoaSao Tome and PrincipeSaudi ArabiaSenegalSerbiaSeychellesSierra LeoneSingaporeSlovak RepublicSloveniaSmall statesSolomon IslandsSomaliaSouth AfricaSouth AsiaSouth Asia (IDA & IBRD)SpainSri LankaSt. Kitts and NevisSt. LuciaSt. Vincent and the GrenadinesSub-Saharan Africa Sub-Saharan Africa (excluding high income)Sub-Saharan Africa (IDA & IBRD countries)SudanSurinameSwazilandSwedenSwitzerlandSyrian Arab RepublicTajikistanTanzaniaThailandTimor-LesteTogoTongaTrinidad and TobagoTunisiaTurkeyTurkmenistanTuvaluUgandaUkraineUnited Arab EmiratesUnited KingdomUnited StatesUpper middle incomeUruguayUzbekistanVanuatuVenezuela, RBVietnamWest Bank and GazaWorldZambiaZimbabwe Timeline:
This timeline shows a graph from 1962 to 2016 of East Asia & Pacific (excluding high income). No data until 1961. Number of actual observations by date: 55.
Source name:
World Development Indicators
Source organization:
World Bank national accounts data, and OECD National Accounts data files.
Categories, topics:
Economy & Growth
Last updated:
apr 23, 2017
Indicators value changes by year
Minimum:
-12.004
jan 1, 1962
Maximum:
14.316
jan 1, 2008
At the date of observation
Value
Absolute change
Change from previous value
jan 1, 1962
-12.004
-12.004
0.0%
jan 1, 1963
-2.688
+9.316
-77.61%
jan 1, 1964
4.156
+6.844
-254.62%
jan 1, 1965
9.599
+5.443
130.96%
jan 1, 1966
9.589
-0.011
-0.11%
jan 1, 1967
1.425
-8.164
-85.14%
jan 1, 1968
3.037
+1.612
113.16%
jan 1, 1969
3.227
+0.191
6.29%
jan 1, 1970
8.956
+5.729
177.5%
jan 1, 1971
7.619
-1.337
-14.93%
jan 1, 1972
6.057
-1.562
-20.5%
jan 1, 1973
5.178
-0.879
-14.51%
jan 1, 1974
6.12
+0.942
18.2%
jan 1, 1975
5.526
-0.594
-9.71%
jan 1, 1976
7.209
+1.683
30.46%
jan 1, 1977
2.392
-4.817
-66.82%
jan 1, 1978
9.272
+6.88
287.59%
jan 1, 1979
11.947
+2.675
28.85%
jan 1, 1980
7.45
-4.498
-37.64%
jan 1, 1981
7.525
+0.075
1.01%
jan 1, 1982
8.903
+1.378
18.32%
jan 1, 1983
9.2
+0.296
3.33%
jan 1, 1984
9.424
+0.225
2.44%
jan 1, 1985
10.828
+1.404
14.9%
jan 1, 1986
10.955
+0.127
1.17%
jan 1, 1987
9.084
-1.871
-17.08%
jan 1, 1988
11.509
+2.425
26.69%
jan 1, 1989
11.272
-0.237
-2.06%
jan 1, 1990
6.545
-4.727
-41.94%
jan 1, 1991
6.051
-0.493
-7.54%
jan 1, 1992
8.889
+2.838
46.89%
jan 1, 1993
8.472
-0.417
-4.69%
jan 1, 1994
12.712
+4.24
50.04%
jan 1, 1995
9.777
-2.935
-23.09%
jan 1, 1996
8.892
-0.885
-9.05%
jan 1, 1997
8.059
-0.833
-9.37%
jan 1, 1998
7.888
-0.171
-2.12%
jan 1, 1999
1.781
-6.107
-77.43%
jan 1, 2000
6.889
+5.108
286.88%
jan 1, 2001
8.363
+1.474
21.4%
jan 1, 2002
8.546
+0.183
2.18%
jan 1, 2003
9.063
+0.517
6.05%
jan 1, 2004
8.42
-0.643
-7.09%
jan 1, 2005
9.356
+0.935
11.11%
jan 1, 2006
10.836
+1.48
15.82%
jan 1, 2007
12.155
+1.32
12.18%
jan 1, 2008
14.316
+2.16
17.77%
jan 1, 2009
9.422
-4.893
-34.18%
jan 1, 2010
8.175
-1.248
-13.24%
jan 1, 2011
8.948
+0.774
9.46%
jan 1, 2012
8.84
-0.108
-1.21%
jan 1, 2013
7.83
-1.011
-11.44%
jan 1, 2014
7.783
-0.047
-0.6%
jan 1, 2015
7.275
-0.508
-6.52%
jan 1, 2016
7.74
+0.466
6.4%
Ranking of countries by current statistics by years


Comments: