29
/
en
AIzaSyAYiBZKx7MnpbEhh9jyipgxe19OcubqV5w
April 1, 2024
54436
Pacific island small states
PSS
false
2
1
Services, etc., value added (annual % growth)
2016,2015,2014,2013,2012,2011,2010,2009,2008,2007,2006,2005,2004,2003,2002,2001,2000,1999,1998,1997,1996,1995,1994,1993,1992,1991,1990,1989,1988,1987,1986,1985,1984,1983,1982,1981
This statistics in other country:
AfghanistanAlbaniaAlgeriaAntigua and BarbudaArab WorldArgentinaArmeniaAustraliaAustriaAzerbaijanBahamas, TheBahrainBangladeshBelarusBelgiumBelizeBeninBermudaBhutanBoliviaBosnia and HerzegovinaBotswanaBrazilBrunei DarussalamBulgariaBurkina FasoBurundiCabo VerdeCambodiaCameroonCanadaCaribbean small statesCentral African RepublicCentral Europe and the BalticsChadChileChinaColombiaComorosCongo, Dem. Rep.Congo, Rep.Costa RicaCote d'IvoireCroatiaCubaCyprusCzech RepublicDenmarkDjiboutiDominicaDominican RepublicEarly-demographic dividendEast Asia & PacificEast Asia & Pacific (excluding high income)East Asia & Pacific (IDA & IBRD countries)EcuadorEgypt, Arab Rep.El SalvadorEquatorial GuineaEritreaEstoniaEthiopiaEuro areaEurope & Central AsiaEurope & Central Asia (excluding high income)Europe & Central Asia (IDA & IBRD countries)European UnionFijiFinlandFragile and conflict affected situationsFranceGabonGambia, TheGeorgiaGermanyGhanaGreeceGrenadaGuatemalaGuineaGuinea-BissauGuyanaHaitiHeavily indebted poor countries (HIPC)High incomeHondurasHong Kong SAR, ChinaHungaryIBRD onlyIcelandIDA & IBRD totalIDA blendIDA onlyIDA totalIndiaIndonesiaIran, Islamic Rep.IraqIrelandItalyJamaicaJapanJordanKazakhstanKenyaKiribatiKorea, Rep.KosovoKuwaitKyrgyz RepublicLao PDRLate-demographic dividendLatin America & Caribbean Latin America & Caribbean (excluding high income)Latin America & the Caribbean (IDA & IBRD countries)LatviaLeast developed countries: UN classificationLebanonLesothoLiberiaLithuaniaLow & middle incomeLow incomeLower middle incomeLuxembourgMacedonia, FYRMadagascarMalawiMalaysiaMaldivesMaliMarshall IslandsMauritaniaMauritiusMexicoMicronesia, Fed. Sts.Middle East & North AfricaMiddle East & North Africa (excluding high income)Middle East & North Africa (IDA & IBRD countries)Middle incomeMoldovaMongoliaMontenegroMoroccoMozambiqueMyanmarNamibiaNepalNetherlandsNew ZealandNicaraguaNigerNigeriaNorth AmericaNorwayOECD membersOmanOther small statesPacific island small statesPakistanPalauPanamaPapua New GuineaParaguayPeruPhilippinesPolandPortugalPost-demographic dividendPre-demographic dividendPuerto RicoQatarRomaniaRussian FederationRwandaSamoaSao Tome and PrincipeSaudi ArabiaSenegalSerbiaSeychellesSierra LeoneSingaporeSlovak RepublicSloveniaSmall statesSolomon IslandsSomaliaSouth AfricaSouth AsiaSouth Asia (IDA & IBRD)SpainSri LankaSt. Kitts and NevisSt. LuciaSt. Vincent and the GrenadinesSub-Saharan Africa Sub-Saharan Africa (excluding high income)Sub-Saharan Africa (IDA & IBRD countries)SudanSurinameSwazilandSwedenSwitzerlandSyrian Arab RepublicTajikistanTanzaniaThailandTimor-LesteTogoTongaTrinidad and TobagoTunisiaTurkeyTurkmenistanTuvaluUgandaUkraineUnited Arab EmiratesUnited KingdomUnited StatesUpper middle incomeUruguayUzbekistanVanuatuVenezuela, RBVietnamWest Bank and GazaWorldZambiaZimbabwe Timeline:
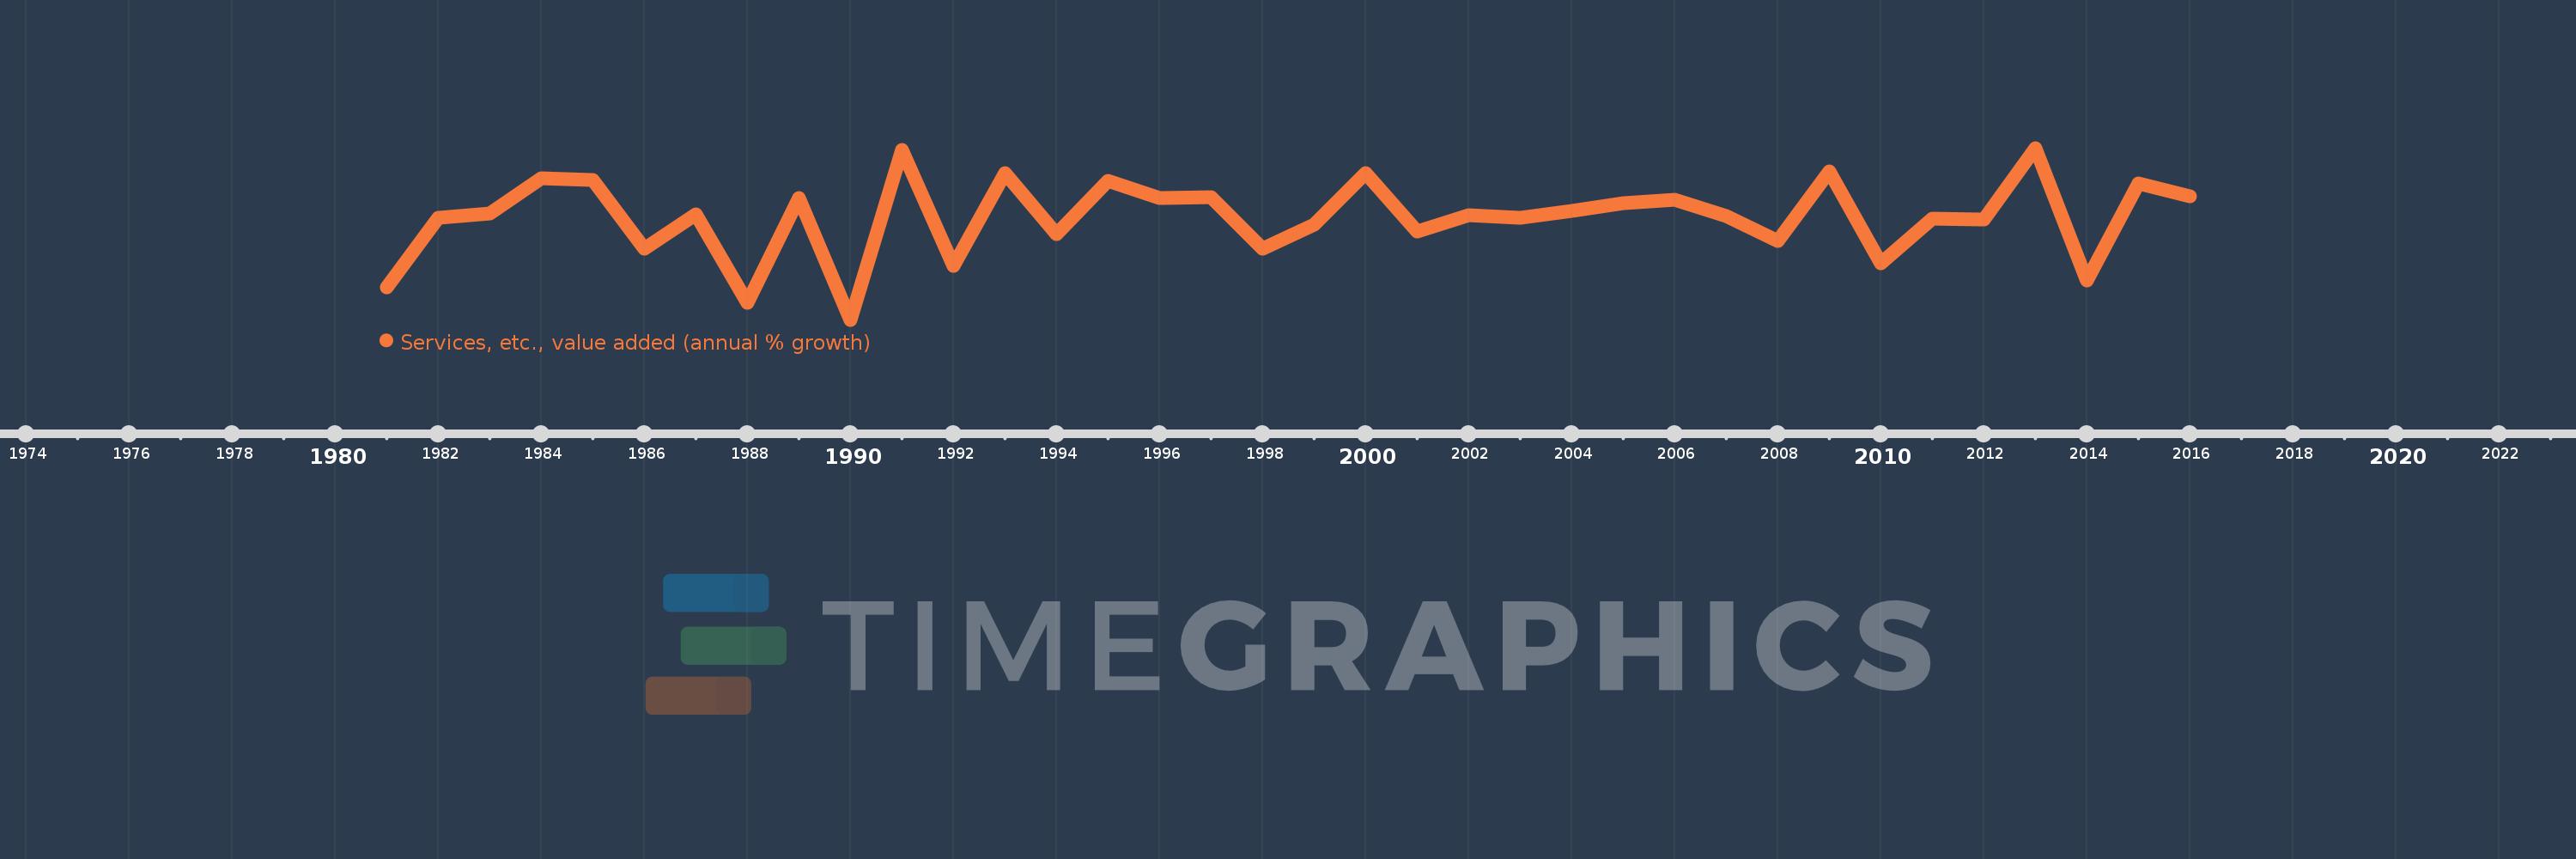
This timeline shows a graph from 1981 to 2016 of Pacific island small states. No data until 1980. Number of actual observations by date: 36.
Source name:
World Development Indicators
Source organization:
World Bank national accounts data, and OECD National Accounts data files.
Categories, topics:
Economy & Growth
Last updated:
apr 23, 2017
Indicators value changes by year
Minimum:
-3.679
jan 1, 1990
At the date of observation
Value
Absolute change
Change from previous value
jan 1, 1981
-1.716
-1.716
0.0%
jan 1, 1982
2.545
+4.261
-248.34%
jan 1, 1983
2.835
+0.29
11.4%
jan 1, 1984
4.975
+2.139
75.46%
jan 1, 1985
4.865
-0.109
-2.2%
jan 1, 1986
0.677
-4.189
-86.09%
jan 1, 1987
2.786
+2.109
311.68%
jan 1, 1988
-2.631
-5.417
-194.45%
jan 1, 1989
3.761
+6.392
-242.93%
jan 1, 1990
-3.679
-7.44
-197.83%
jan 1, 1991
6.7
+10.379
-282.11%
jan 1, 1992
-0.378
-7.078
-105.65%
jan 1, 1993
5.304
+5.682
-1.5K%
jan 1, 1994
1.586
-3.717
-70.09%
jan 1, 1995
4.845
+3.259
205.46%
jan 1, 1996
3.767
-1.078
-22.25%
jan 1, 1997
3.829
+0.063
1.66%
jan 1, 1998
0.669
-3.161
-82.54%
jan 1, 1999
2.142
+1.474
220.4%
jan 1, 2000
5.303
+3.16
147.5%
jan 1, 2001
1.723
-3.58
-67.51%
jan 1, 2002
2.696
+0.973
56.47%
jan 1, 2003
2.579
-0.117
-4.34%
jan 1, 2004
2.975
+0.396
15.36%
jan 1, 2005
3.457
+0.482
16.2%
jan 1, 2006
3.65
+0.193
5.57%
jan 1, 2007
2.658
-0.992
-27.18%
jan 1, 2008
1.124
-1.534
-57.71%
jan 1, 2009
5.406
+4.282
380.95%
jan 1, 2010
-0.221
-5.627
-104.1%
jan 1, 2011
2.508
+2.73
-1.23K%
jan 1, 2012
2.45
-0.058
-2.31%
jan 1, 2013
6.832
+4.382
178.85%
jan 1, 2014
-1.281
-8.113
-118.75%
jan 1, 2015
4.675
+5.956
-464.93%
jan 1, 2016
3.869
-0.805
-17.22%
Ranking of countries by current statistics by years


Comments: