29
/
en
AIzaSyAYiBZKx7MnpbEhh9jyipgxe19OcubqV5w
April 1, 2024
110357
Congo, Dem. Rep.
COD
true
2
1
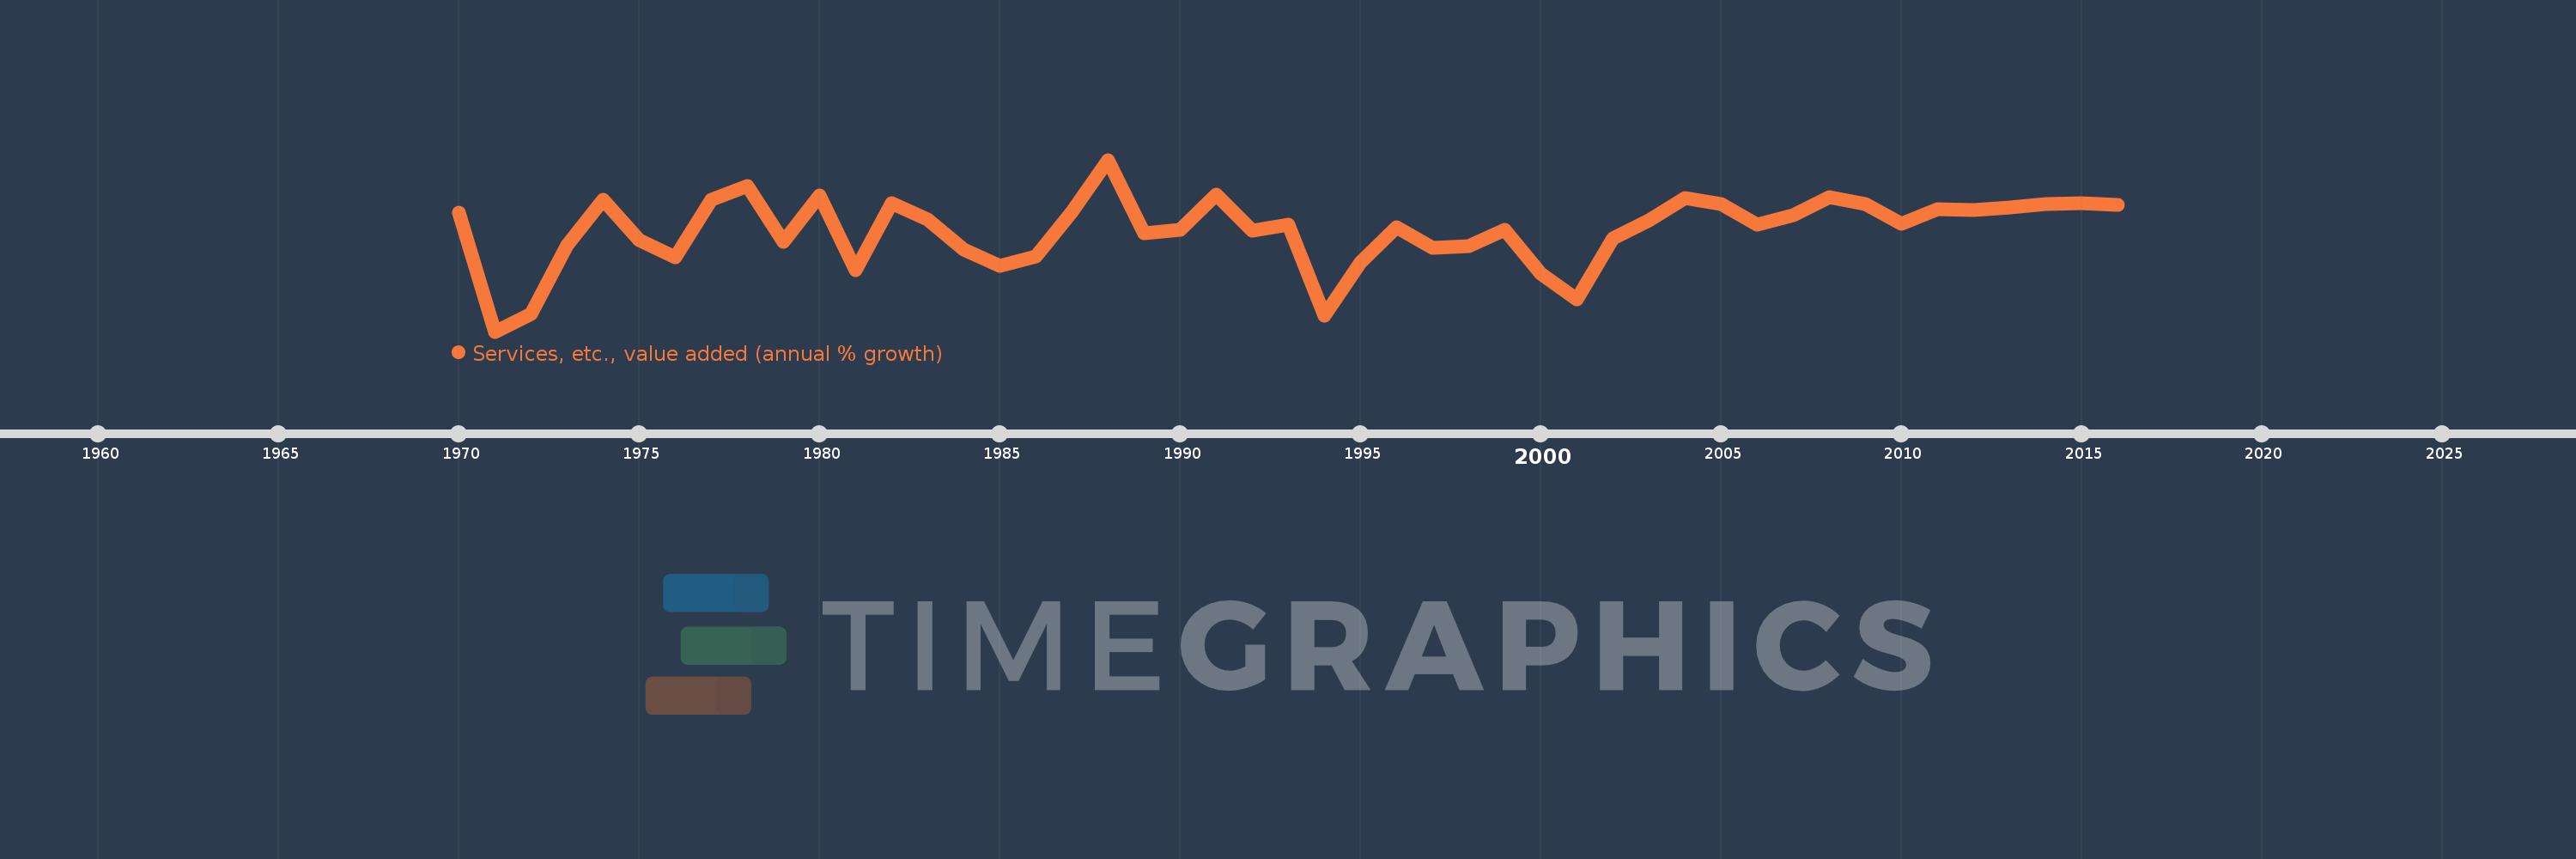
Services, etc., value added (annual % growth)
2016,2015,2014,2013,2012,2011,2010,2009,2008,2007,2006,2005,2004,2003,2002,2001,2000,1999,1998,1997,1996,1995,1994,1993,1992,1991,1990,1989,1988,1987,1986,1985,1984,1983,1982,1981,1980,1979,1978,1977,1976,1975,1974,1973,1972,1971,1970
This statistics in other country:
AfghanistanAlbaniaAlgeriaAntigua and BarbudaArab WorldArgentinaArmeniaAustraliaAustriaAzerbaijanBahamas, TheBahrainBangladeshBelarusBelgiumBelizeBeninBermudaBhutanBoliviaBosnia and HerzegovinaBotswanaBrazilBrunei DarussalamBulgariaBurkina FasoBurundiCabo VerdeCambodiaCameroonCanadaCaribbean small statesCentral African RepublicCentral Europe and the BalticsChadChileChinaColombiaComorosCongo, Dem. Rep.Congo, Rep.Costa RicaCote d'IvoireCroatiaCubaCyprusCzech RepublicDenmarkDjiboutiDominicaDominican RepublicEarly-demographic dividendEast Asia & PacificEast Asia & Pacific (excluding high income)East Asia & Pacific (IDA & IBRD countries)EcuadorEgypt, Arab Rep.El SalvadorEquatorial GuineaEritreaEstoniaEthiopiaEuro areaEurope & Central AsiaEurope & Central Asia (excluding high income)Europe & Central Asia (IDA & IBRD countries)European UnionFijiFinlandFragile and conflict affected situationsFranceGabonGambia, TheGeorgiaGermanyGhanaGreeceGrenadaGuatemalaGuineaGuinea-BissauGuyanaHaitiHeavily indebted poor countries (HIPC)High incomeHondurasHong Kong SAR, ChinaHungaryIBRD onlyIcelandIDA & IBRD totalIDA blendIDA onlyIDA totalIndiaIndonesiaIran, Islamic Rep.IraqIrelandItalyJamaicaJapanJordanKazakhstanKenyaKiribatiKorea, Rep.KosovoKuwaitKyrgyz RepublicLao PDRLate-demographic dividendLatin America & Caribbean Latin America & Caribbean (excluding high income)Latin America & the Caribbean (IDA & IBRD countries)LatviaLeast developed countries: UN classificationLebanonLesothoLiberiaLithuaniaLow & middle incomeLow incomeLower middle incomeLuxembourgMacedonia, FYRMadagascarMalawiMalaysiaMaldivesMaliMarshall IslandsMauritaniaMauritiusMexicoMicronesia, Fed. Sts.Middle East & North AfricaMiddle East & North Africa (excluding high income)Middle East & North Africa (IDA & IBRD countries)Middle incomeMoldovaMongoliaMontenegroMoroccoMozambiqueMyanmarNamibiaNepalNetherlandsNew ZealandNicaraguaNigerNigeriaNorth AmericaNorwayOECD membersOmanOther small statesPacific island small statesPakistanPalauPanamaPapua New GuineaParaguayPeruPhilippinesPolandPortugalPost-demographic dividendPre-demographic dividendPuerto RicoQatarRomaniaRussian FederationRwandaSamoaSao Tome and PrincipeSaudi ArabiaSenegalSerbiaSeychellesSierra LeoneSingaporeSlovak RepublicSloveniaSmall statesSolomon IslandsSomaliaSouth AfricaSouth AsiaSouth Asia (IDA & IBRD)SpainSri LankaSt. Kitts and NevisSt. LuciaSt. Vincent and the GrenadinesSub-Saharan Africa Sub-Saharan Africa (excluding high income)Sub-Saharan Africa (IDA & IBRD countries)SudanSurinameSwazilandSwedenSwitzerlandSyrian Arab RepublicTajikistanTanzaniaThailandTimor-LesteTogoTongaTrinidad and TobagoTunisiaTurkeyTurkmenistanTuvaluUgandaUkraineUnited Arab EmiratesUnited KingdomUnited StatesUpper middle incomeUruguayUzbekistanVanuatuVenezuela, RBVietnamWest Bank and GazaWorldZambiaZimbabwe Timeline:
This timeline shows a graph from 1970 to 2016 of Congo, Dem. Rep.. No data until 1969. Number of actual observations by date: 47.
Source name:
World Development Indicators
Source organization:
World Bank national accounts data, and OECD National Accounts data files.
Categories, topics:
Economy & Growth
Last updated:
apr 23, 2017
Indicators value changes by year
Minimum:
-25.794
jan 1, 1971
Maximum:
21.516
jan 1, 1988
At the date of observation
Value
Absolute change
Change from previous value
jan 1, 1970
7.084
+7.084
0.0%
jan 1, 1971
-25.794
-32.878
-464.13%
jan 1, 1972
-20.865
+4.929
-19.11%
jan 1, 1973
-1.949
+18.916
-90.66%
jan 1, 1974
10.555
+12.504
-641.56%
jan 1, 1975
-0.628
-11.183
-105.95%
jan 1, 1976
-5.325
-4.698
748.46%
jan 1, 1977
10.606
+15.931
-299.16%
jan 1, 1978
14.336
+3.73
35.17%
jan 1, 1979
-1.131
-15.466
-107.89%
jan 1, 1980
11.582
+12.712
-1.12K%
jan 1, 1981
-8.775
-20.356
-175.76%
jan 1, 1982
9.616
+18.391
-209.59%
jan 1, 1983
4.982
-4.634
-48.2%
jan 1, 1984
-3.188
-8.169
-163.99%
jan 1, 1985
-7.687
-4.499
141.15%
jan 1, 1986
-5.124
+2.563
-33.34%
jan 1, 1987
7.205
+12.329
-240.6%
jan 1, 1988
21.516
+14.311
198.63%
jan 1, 1989
1.188
-20.328
-94.48%
jan 1, 1990
2.153
+0.965
81.28%
jan 1, 1991
12.038
+9.885
459.12%
jan 1, 1992
1.983
-10.056
-83.53%
jan 1, 1993
3.772
+1.789
90.24%
jan 1, 1994
-21.305
-25.077
-664.8%
jan 1, 1995
-6.756
+14.549
-68.29%
jan 1, 1996
2.875
+9.632
-142.56%
jan 1, 1997
-2.761
-5.636
-196.01%
jan 1, 1998
-2.357
+0.404
-14.65%
jan 1, 1999
2.332
+4.689
-198.96%
jan 1, 2000
-9.718
-12.05
-516.7%
jan 1, 2001
-16.858
-7.14
73.47%
jan 1, 2002
-0.162
+16.696
-99.04%
jan 1, 2003
4.957
+5.118
-3.17K%
jan 1, 2004
11.069
+6.112
123.32%
jan 1, 2005
9.396
-1.673
-15.12%
jan 1, 2006
3.743
-5.653
-60.16%
jan 1, 2007
6.285
+2.542
67.92%
jan 1, 2008
11.226
+4.94
78.6%
jan 1, 2009
9.229
-1.997
-17.79%
jan 1, 2010
3.784
-5.445
-59.0%
jan 1, 2011
7.83
+4.046
106.94%
jan 1, 2012
7.657
-0.174
-2.22%
jan 1, 2013
8.375
+0.718
9.38%
jan 1, 2014
9.4
+1.025
12.24%
jan 1, 2015
9.542
+0.142
1.51%
jan 1, 2016
9.085
-0.457
-4.79%
Ranking of countries by current statistics by years


Comments: