29
/
en
AIzaSyAYiBZKx7MnpbEhh9jyipgxe19OcubqV5w
April 1, 2024
185898
Madagascar
MDG
true
2
1
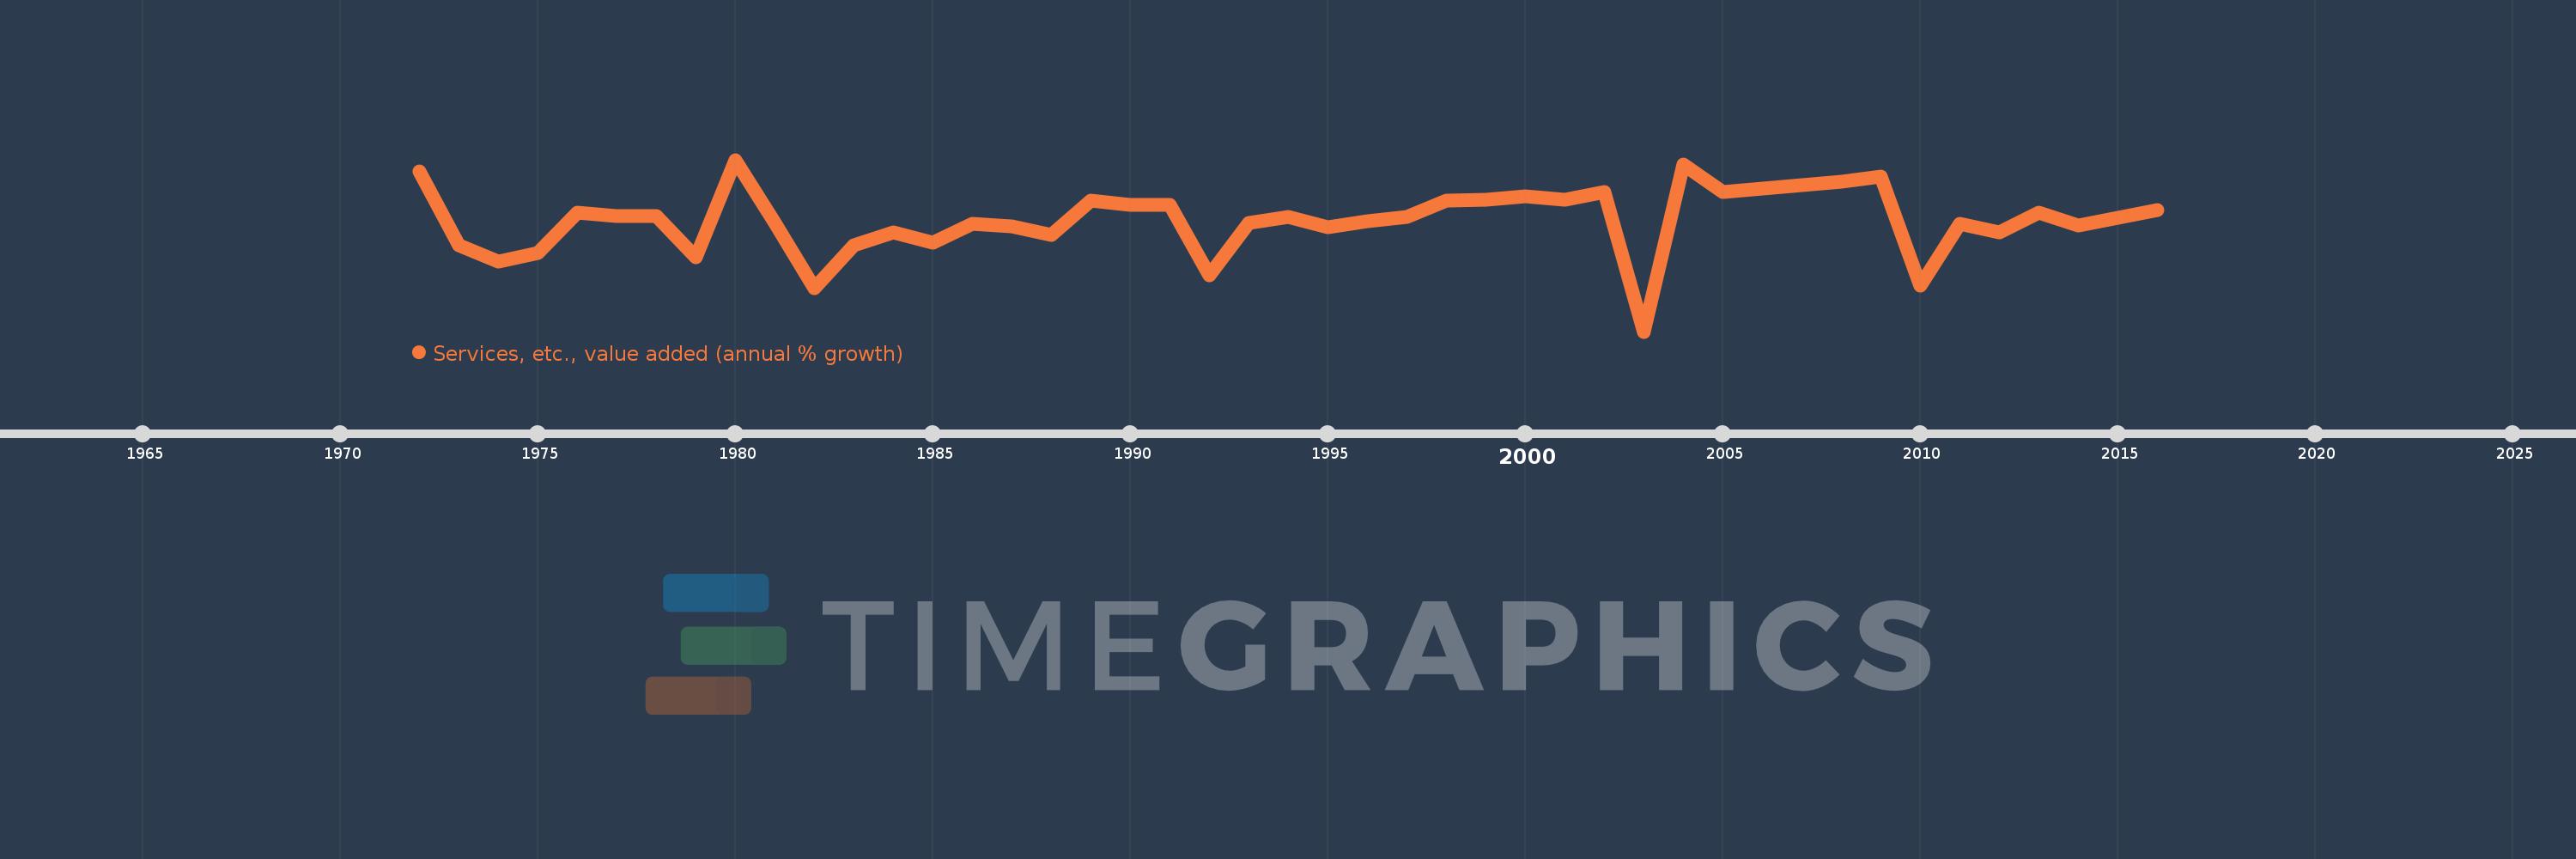
Services, etc., value added (annual % growth)
2016,2015,2014,2013,2012,2011,2010,2009,2008,2005,2004,2003,2002,2001,2000,1999,1998,1997,1996,1995,1994,1993,1992,1991,1990,1989,1988,1987,1986,1985,1984,1983,1982,1981,1980,1979,1978,1977,1976,1975,1974,1973,1972
This statistics in other country:
AfghanistanAlbaniaAlgeriaAntigua and BarbudaArab WorldArgentinaArmeniaAustraliaAustriaAzerbaijanBahamas, TheBahrainBangladeshBelarusBelgiumBelizeBeninBermudaBhutanBoliviaBosnia and HerzegovinaBotswanaBrazilBrunei DarussalamBulgariaBurkina FasoBurundiCabo VerdeCambodiaCameroonCanadaCaribbean small statesCentral African RepublicCentral Europe and the BalticsChadChileChinaColombiaComorosCongo, Dem. Rep.Congo, Rep.Costa RicaCote d'IvoireCroatiaCubaCyprusCzech RepublicDenmarkDjiboutiDominicaDominican RepublicEarly-demographic dividendEast Asia & PacificEast Asia & Pacific (excluding high income)East Asia & Pacific (IDA & IBRD countries)EcuadorEgypt, Arab Rep.El SalvadorEquatorial GuineaEritreaEstoniaEthiopiaEuro areaEurope & Central AsiaEurope & Central Asia (excluding high income)Europe & Central Asia (IDA & IBRD countries)European UnionFijiFinlandFragile and conflict affected situationsFranceGabonGambia, TheGeorgiaGermanyGhanaGreeceGrenadaGuatemalaGuineaGuinea-BissauGuyanaHaitiHeavily indebted poor countries (HIPC)High incomeHondurasHong Kong SAR, ChinaHungaryIBRD onlyIcelandIDA & IBRD totalIDA blendIDA onlyIDA totalIndiaIndonesiaIran, Islamic Rep.IraqIrelandItalyJamaicaJapanJordanKazakhstanKenyaKiribatiKorea, Rep.KosovoKuwaitKyrgyz RepublicLao PDRLate-demographic dividendLatin America & Caribbean Latin America & Caribbean (excluding high income)Latin America & the Caribbean (IDA & IBRD countries)LatviaLeast developed countries: UN classificationLebanonLesothoLiberiaLithuaniaLow & middle incomeLow incomeLower middle incomeLuxembourgMacedonia, FYRMadagascarMalawiMalaysiaMaldivesMaliMarshall IslandsMauritaniaMauritiusMexicoMicronesia, Fed. Sts.Middle East & North AfricaMiddle East & North Africa (excluding high income)Middle East & North Africa (IDA & IBRD countries)Middle incomeMoldovaMongoliaMontenegroMoroccoMozambiqueMyanmarNamibiaNepalNetherlandsNew ZealandNicaraguaNigerNigeriaNorth AmericaNorwayOECD membersOmanOther small statesPacific island small statesPakistanPalauPanamaPapua New GuineaParaguayPeruPhilippinesPolandPortugalPost-demographic dividendPre-demographic dividendPuerto RicoQatarRomaniaRussian FederationRwandaSamoaSao Tome and PrincipeSaudi ArabiaSenegalSerbiaSeychellesSierra LeoneSingaporeSlovak RepublicSloveniaSmall statesSolomon IslandsSomaliaSouth AfricaSouth AsiaSouth Asia (IDA & IBRD)SpainSri LankaSt. Kitts and NevisSt. LuciaSt. Vincent and the GrenadinesSub-Saharan Africa Sub-Saharan Africa (excluding high income)Sub-Saharan Africa (IDA & IBRD countries)SudanSurinameSwazilandSwedenSwitzerlandSyrian Arab RepublicTajikistanTanzaniaThailandTimor-LesteTogoTongaTrinidad and TobagoTunisiaTurkeyTurkmenistanTuvaluUgandaUkraineUnited Arab EmiratesUnited KingdomUnited StatesUpper middle incomeUruguayUzbekistanVanuatuVenezuela, RBVietnamWest Bank and GazaWorldZambiaZimbabwe Timeline:
This timeline shows a graph from 1972 to 2016 of Madagascar. No data until 1971. Number of actual observations by date: 43.
Source name:
World Development Indicators
Source organization:
World Bank national accounts data, and OECD National Accounts data files.
Categories, topics:
Economy & Growth
Last updated:
apr 23, 2017
Indicators value changes by year
Minimum:
-15.872
jan 1, 2003
Maximum:
11.144
jan 1, 1980
At the date of observation
Value
Absolute change
Change from previous value
jan 1, 1972
9.346
+9.346
0.0%
jan 1, 1973
-2.346
-11.692
-125.1%
jan 1, 1974
-4.88
-2.534
107.99%
jan 1, 1975
-3.572
+1.308
-26.8%
jan 1, 1976
2.838
+6.41
-179.46%
jan 1, 1977
2.255
-0.583
-20.56%
jan 1, 1978
2.245
-0.01
-0.44%
jan 1, 1979
-4.19
-6.435
-286.66%
jan 1, 1980
11.144
+15.334
-365.98%
jan 1, 1981
1.22
-9.924
-89.05%
jan 1, 1982
-8.995
-10.215
-837.26%
jan 1, 1983
-2.232
+6.763
-75.19%
jan 1, 1984
-0.25
+1.982
-88.8%
jan 1, 1985
-1.854
-1.604
641.74%
jan 1, 1986
1.131
+2.985
-160.99%
jan 1, 1987
0.641
-0.49
-43.3%
jan 1, 1988
-0.659
-1.3
-202.72%
jan 1, 1989
4.711
+5.37
-815.24%
jan 1, 1990
4.028
-0.682
-14.49%
jan 1, 1991
4.021
-0.008
-0.19%
jan 1, 1992
-7.042
-11.063
-275.14%
jan 1, 1993
1.15
+8.192
-116.33%
jan 1, 1994
2.165
+1.015
88.24%
jan 1, 1995
0.503
-1.662
-76.76%
jan 1, 1996
1.538
+1.034
205.6%
jan 1, 1997
2.139
+0.601
39.11%
jan 1, 1998
4.755
+2.617
122.33%
jan 1, 1999
4.815
+0.06
1.25%
jan 1, 2000
5.467
+0.652
13.54%
jan 1, 2001
4.809
-0.658
-12.03%
jan 1, 2002
6.089
+1.28
26.61%
jan 1, 2003
-15.872
-21.961
-360.68%
jan 1, 2004
10.45
+26.322
-165.84%
jan 1, 2005
6.018
-4.431
-42.41%
jan 1, 2008
7.728
+1.709
28.4%
jan 1, 2009
8.454
+0.727
9.41%
jan 1, 2010
-8.594
-17.048
-201.65%
jan 1, 2011
1.137
+9.73
-113.23%
jan 1, 2012
-0.283
-1.419
-124.86%
jan 1, 2013
2.818
+3.1
-1.1K%
jan 1, 2014
0.832
-1.986
-70.48%
jan 1, 2015
2.053
+1.221
146.83%
jan 1, 2016
3.203
+1.15
56.0%
Ranking of countries by current statistics by years


Comments: