29
/
en
AIzaSyAYiBZKx7MnpbEhh9jyipgxe19OcubqV5w
April 1, 2024
133628
Finland
FIN
true
2
1
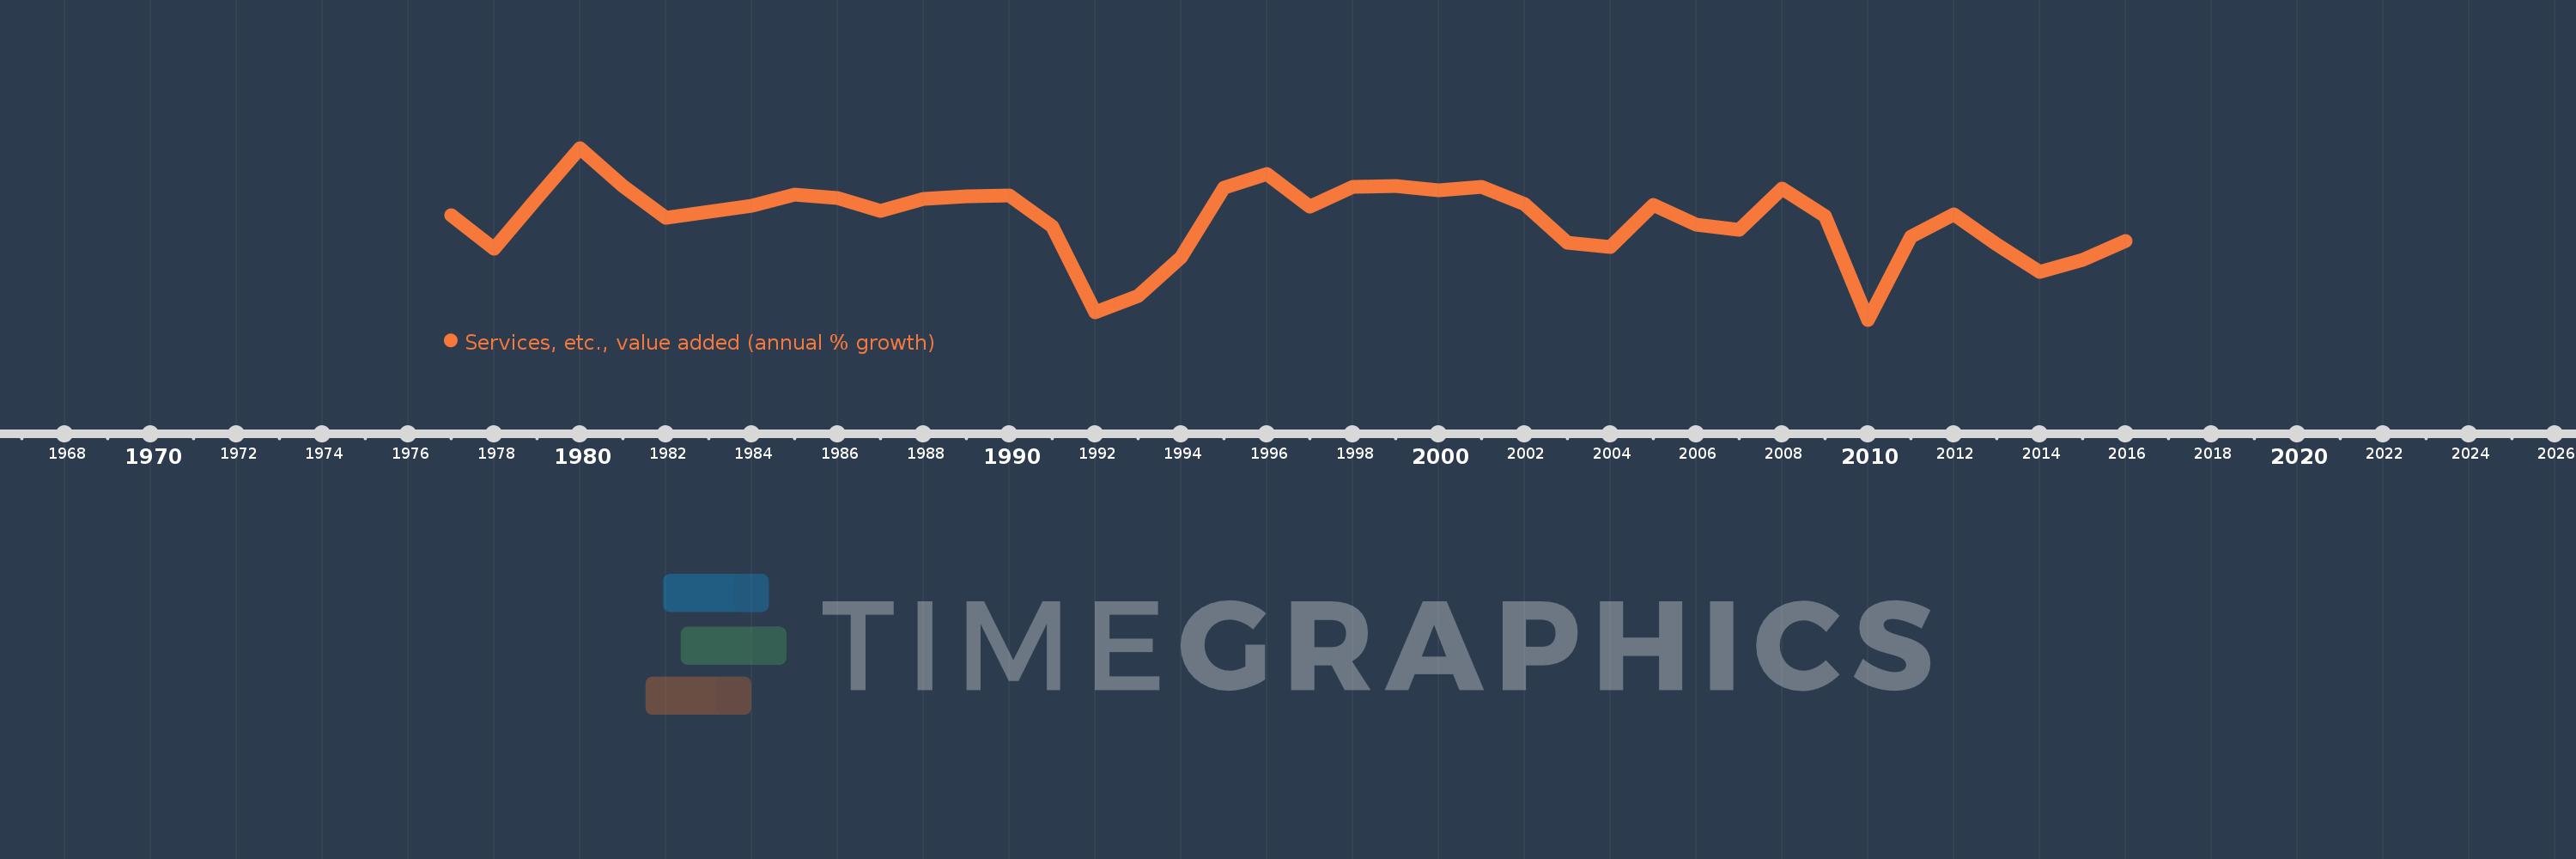
Services, etc., value added (annual % growth)
2016,2015,2014,2013,2012,2011,2010,2009,2008,2007,2006,2005,2004,2003,2002,2001,2000,1999,1998,1997,1996,1995,1994,1993,1992,1991,1990,1989,1988,1987,1986,1985,1984,1983,1982,1981,1980,1979,1978,1977
This statistics in other country:
AfghanistanAlbaniaAlgeriaAntigua and BarbudaArab WorldArgentinaArmeniaAustraliaAustriaAzerbaijanBahamas, TheBahrainBangladeshBelarusBelgiumBelizeBeninBermudaBhutanBoliviaBosnia and HerzegovinaBotswanaBrazilBrunei DarussalamBulgariaBurkina FasoBurundiCabo VerdeCambodiaCameroonCanadaCaribbean small statesCentral African RepublicCentral Europe and the BalticsChadChileChinaColombiaComorosCongo, Dem. Rep.Congo, Rep.Costa RicaCote d'IvoireCroatiaCubaCyprusCzech RepublicDenmarkDjiboutiDominicaDominican RepublicEarly-demographic dividendEast Asia & PacificEast Asia & Pacific (excluding high income)East Asia & Pacific (IDA & IBRD countries)EcuadorEgypt, Arab Rep.El SalvadorEquatorial GuineaEritreaEstoniaEthiopiaEuro areaEurope & Central AsiaEurope & Central Asia (excluding high income)Europe & Central Asia (IDA & IBRD countries)European UnionFijiFinlandFragile and conflict affected situationsFranceGabonGambia, TheGeorgiaGermanyGhanaGreeceGrenadaGuatemalaGuineaGuinea-BissauGuyanaHaitiHeavily indebted poor countries (HIPC)High incomeHondurasHong Kong SAR, ChinaHungaryIBRD onlyIcelandIDA & IBRD totalIDA blendIDA onlyIDA totalIndiaIndonesiaIran, Islamic Rep.IraqIrelandItalyJamaicaJapanJordanKazakhstanKenyaKiribatiKorea, Rep.KosovoKuwaitKyrgyz RepublicLao PDRLate-demographic dividendLatin America & Caribbean Latin America & Caribbean (excluding high income)Latin America & the Caribbean (IDA & IBRD countries)LatviaLeast developed countries: UN classificationLebanonLesothoLiberiaLithuaniaLow & middle incomeLow incomeLower middle incomeLuxembourgMacedonia, FYRMadagascarMalawiMalaysiaMaldivesMaliMarshall IslandsMauritaniaMauritiusMexicoMicronesia, Fed. Sts.Middle East & North AfricaMiddle East & North Africa (excluding high income)Middle East & North Africa (IDA & IBRD countries)Middle incomeMoldovaMongoliaMontenegroMoroccoMozambiqueMyanmarNamibiaNepalNetherlandsNew ZealandNicaraguaNigerNigeriaNorth AmericaNorwayOECD membersOmanOther small statesPacific island small statesPakistanPalauPanamaPapua New GuineaParaguayPeruPhilippinesPolandPortugalPost-demographic dividendPre-demographic dividendPuerto RicoQatarRomaniaRussian FederationRwandaSamoaSao Tome and PrincipeSaudi ArabiaSenegalSerbiaSeychellesSierra LeoneSingaporeSlovak RepublicSloveniaSmall statesSolomon IslandsSomaliaSouth AfricaSouth AsiaSouth Asia (IDA & IBRD)SpainSri LankaSt. Kitts and NevisSt. LuciaSt. Vincent and the GrenadinesSub-Saharan Africa Sub-Saharan Africa (excluding high income)Sub-Saharan Africa (IDA & IBRD countries)SudanSurinameSwazilandSwedenSwitzerlandSyrian Arab RepublicTajikistanTanzaniaThailandTimor-LesteTogoTongaTrinidad and TobagoTunisiaTurkeyTurkmenistanTuvaluUgandaUkraineUnited Arab EmiratesUnited KingdomUnited StatesUpper middle incomeUruguayUzbekistanVanuatuVenezuela, RBVietnamWest Bank and GazaWorldZambiaZimbabwe Timeline:
This timeline shows a graph from 1977 to 2016 of Finland. No data until 1976. Number of actual observations by date: 40.
Source name:
World Development Indicators
Source organization:
World Bank national accounts data, and OECD National Accounts data files.
Categories, topics:
Economy & Growth
Last updated:
apr 23, 2017
Indicators value changes by year
Minimum:
-4.895
jan 1, 2010
At the date of observation
Value
Absolute change
Change from previous value
jan 1, 1977
2.761
+2.761
0.0%
jan 1, 1978
0.269
-2.491
-90.24%
jan 1, 1979
3.975
+3.705
1.38K%
jan 1, 1980
7.64
+3.665
92.21%
jan 1, 1981
4.864
-2.776
-36.34%
jan 1, 1982
2.516
-2.347
-48.26%
jan 1, 1983
2.989
+0.473
18.79%
jan 1, 1984
3.438
+0.448
15.0%
jan 1, 1985
4.255
+0.817
23.77%
jan 1, 1986
3.992
-0.263
-6.18%
jan 1, 1987
3.069
-0.923
-23.13%
jan 1, 1988
3.905
+0.836
27.25%
jan 1, 1989
4.122
+0.217
5.56%
jan 1, 1990
4.181
+0.059
1.44%
jan 1, 1991
1.932
-2.249
-53.79%
jan 1, 1992
-4.331
-6.263
-324.16%
jan 1, 1993
-3.154
+1.177
-27.18%
jan 1, 1994
-0.322
+2.832
-89.79%
jan 1, 1995
4.716
+5.038
-1.57K%
jan 1, 1996
5.712
+0.996
21.12%
jan 1, 1997
3.351
-2.361
-41.34%
jan 1, 1998
4.771
+1.42
42.37%
jan 1, 1999
4.879
+0.108
2.26%
jan 1, 2000
4.581
-0.298
-6.1%
jan 1, 2001
4.778
+0.197
4.29%
jan 1, 2002
3.559
-1.219
-25.51%
jan 1, 2003
0.733
-2.826
-79.4%
jan 1, 2004
0.444
-0.289
-39.39%
jan 1, 2005
3.482
+3.038
683.53%
jan 1, 2006
2.018
-1.464
-42.05%
jan 1, 2007
1.636
-0.382
-18.91%
jan 1, 2008
4.679
+3.043
185.99%
jan 1, 2009
2.679
-2.0
-42.74%
jan 1, 2010
-4.895
-7.575
-282.71%
jan 1, 2011
1.172
+6.068
-123.95%
jan 1, 2012
2.816
+1.644
140.21%
jan 1, 2013
0.616
-2.201
-78.14%
jan 1, 2014
-1.423
-2.039
-331.15%
jan 1, 2015
-0.501
+0.922
-64.77%
jan 1, 2016
0.874
+1.375
-274.23%
Ranking of countries by current statistics by years


Comments: