29
/
en
AIzaSyAYiBZKx7MnpbEhh9jyipgxe19OcubqV5w
April 1, 2024
50466
Middle East & North Africa (IDA & IBRD countries)
TMN
false
2
1
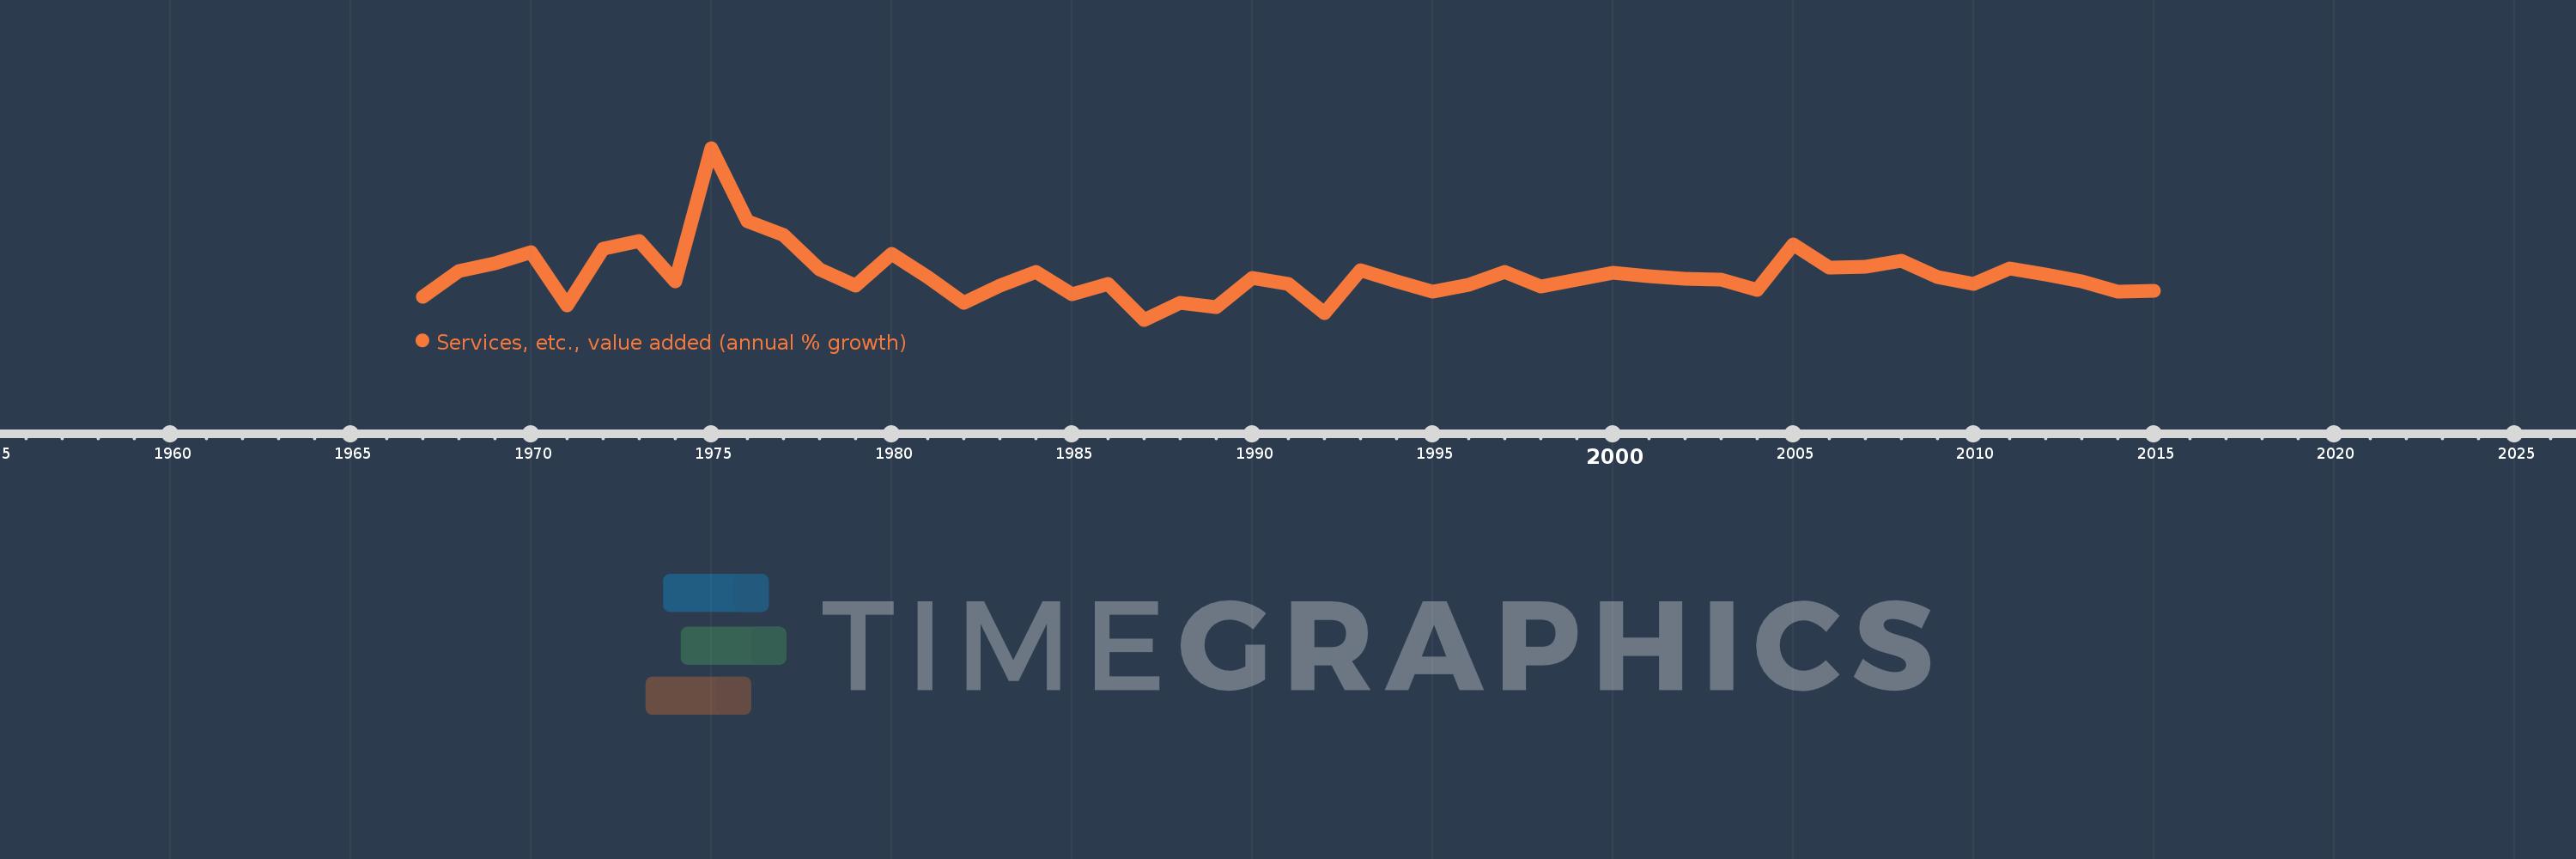
Services, etc., value added (annual % growth)
2015,2014,2013,2012,2011,2010,2009,2008,2007,2006,2005,2004,2003,2002,2001,2000,1999,1998,1997,1996,1995,1994,1993,1992,1991,1990,1989,1988,1987,1986,1985,1984,1983,1982,1981,1980,1979,1978,1977,1976,1975,1974,1973,1972,1971,1970,1969,1968,1967
This statistics in other country:
AfghanistanAlbaniaAlgeriaAntigua and BarbudaArab WorldArgentinaArmeniaAustraliaAustriaAzerbaijanBahamas, TheBahrainBangladeshBelarusBelgiumBelizeBeninBermudaBhutanBoliviaBosnia and HerzegovinaBotswanaBrazilBrunei DarussalamBulgariaBurkina FasoBurundiCabo VerdeCambodiaCameroonCanadaCaribbean small statesCentral African RepublicCentral Europe and the BalticsChadChileChinaColombiaComorosCongo, Dem. Rep.Congo, Rep.Costa RicaCote d'IvoireCroatiaCubaCyprusCzech RepublicDenmarkDjiboutiDominicaDominican RepublicEarly-demographic dividendEast Asia & PacificEast Asia & Pacific (excluding high income)East Asia & Pacific (IDA & IBRD countries)EcuadorEgypt, Arab Rep.El SalvadorEquatorial GuineaEritreaEstoniaEthiopiaEuro areaEurope & Central AsiaEurope & Central Asia (excluding high income)Europe & Central Asia (IDA & IBRD countries)European UnionFijiFinlandFragile and conflict affected situationsFranceGabonGambia, TheGeorgiaGermanyGhanaGreeceGrenadaGuatemalaGuineaGuinea-BissauGuyanaHaitiHeavily indebted poor countries (HIPC)High incomeHondurasHong Kong SAR, ChinaHungaryIBRD onlyIcelandIDA & IBRD totalIDA blendIDA onlyIDA totalIndiaIndonesiaIran, Islamic Rep.IraqIrelandItalyJamaicaJapanJordanKazakhstanKenyaKiribatiKorea, Rep.KosovoKuwaitKyrgyz RepublicLao PDRLate-demographic dividendLatin America & Caribbean Latin America & Caribbean (excluding high income)Latin America & the Caribbean (IDA & IBRD countries)LatviaLeast developed countries: UN classificationLebanonLesothoLiberiaLithuaniaLow & middle incomeLow incomeLower middle incomeLuxembourgMacedonia, FYRMadagascarMalawiMalaysiaMaldivesMaliMarshall IslandsMauritaniaMauritiusMexicoMicronesia, Fed. Sts.Middle East & North AfricaMiddle East & North Africa (excluding high income)Middle East & North Africa (IDA & IBRD countries)Middle incomeMoldovaMongoliaMontenegroMoroccoMozambiqueMyanmarNamibiaNepalNetherlandsNew ZealandNicaraguaNigerNigeriaNorth AmericaNorwayOECD membersOmanOther small statesPacific island small statesPakistanPalauPanamaPapua New GuineaParaguayPeruPhilippinesPolandPortugalPost-demographic dividendPre-demographic dividendPuerto RicoQatarRomaniaRussian FederationRwandaSamoaSao Tome and PrincipeSaudi ArabiaSenegalSerbiaSeychellesSierra LeoneSingaporeSlovak RepublicSloveniaSmall statesSolomon IslandsSomaliaSouth AfricaSouth AsiaSouth Asia (IDA & IBRD)SpainSri LankaSt. Kitts and NevisSt. LuciaSt. Vincent and the GrenadinesSub-Saharan Africa Sub-Saharan Africa (excluding high income)Sub-Saharan Africa (IDA & IBRD countries)SudanSurinameSwazilandSwedenSwitzerlandSyrian Arab RepublicTajikistanTanzaniaThailandTimor-LesteTogoTongaTrinidad and TobagoTunisiaTurkeyTurkmenistanTuvaluUgandaUkraineUnited Arab EmiratesUnited KingdomUnited StatesUpper middle incomeUruguayUzbekistanVanuatuVenezuela, RBVietnamWest Bank and GazaWorldZambiaZimbabwe Timeline:
This timeline shows a graph from 1967 to 2015 of Middle East & North Africa (IDA & IBRD countries). No data until 1966. Number of actual observations by date: 49.
Source name:
World Development Indicators
Source organization:
World Bank national accounts data, and OECD National Accounts data files.
Categories, topics:
Economy & Growth
Last updated:
apr 23, 2017
Indicators value changes by year
Minimum:
-4.293
jan 1, 1987
Maximum:
31.954
jan 1, 1975
At the date of observation
Value
Absolute change
Change from previous value
jan 1, 1967
0.551
+0.551
0.0%
jan 1, 1968
5.903
+5.352
971.92%
jan 1, 1969
7.577
+1.674
28.36%
jan 1, 1970
9.899
+2.322
30.65%
jan 1, 1971
-1.322
-11.22
-113.35%
jan 1, 1972
10.784
+12.106
-915.78%
jan 1, 1973
12.287
+1.504
13.94%
jan 1, 1974
3.736
-8.552
-69.6%
jan 1, 1975
31.954
+28.218
755.35%
jan 1, 1976
16.483
-15.471
-48.42%
jan 1, 1977
13.569
-2.914
-17.68%
jan 1, 1978
6.287
-7.282
-53.67%
jan 1, 1979
2.891
-3.396
-54.02%
jan 1, 1980
9.621
+6.73
232.82%
jan 1, 1981
4.647
-4.974
-51.7%
jan 1, 1982
-0.775
-5.422
-116.69%
jan 1, 1983
2.843
+3.618
-466.63%
jan 1, 1984
5.859
+3.016
106.1%
jan 1, 1985
1.18
-4.679
-79.85%
jan 1, 1986
3.271
+2.09
177.09%
jan 1, 1987
-4.293
-7.564
-231.25%
jan 1, 1988
-0.722
+3.57
-83.17%
jan 1, 1989
-1.579
-0.856
118.55%
jan 1, 1990
4.494
+6.072
-384.61%
jan 1, 1991
3.332
-1.162
-25.86%
jan 1, 1992
-2.827
-6.159
-184.85%
jan 1, 1993
6.106
+8.933
-316.0%
jan 1, 1994
3.768
-2.339
-38.3%
jan 1, 1995
1.65
-2.118
-56.21%
jan 1, 1996
3.063
+1.413
85.65%
jan 1, 1997
5.748
+2.685
87.65%
jan 1, 1998
2.754
-2.994
-52.09%
jan 1, 1999
4.211
+1.458
52.93%
jan 1, 2000
5.599
+1.388
32.96%
jan 1, 2001
4.844
-0.755
-13.48%
jan 1, 2002
4.416
-0.429
-8.85%
jan 1, 2003
4.138
-0.277
-6.28%
jan 1, 2004
1.94
-2.198
-53.11%
jan 1, 2005
11.561
+9.62
495.79%
jan 1, 2006
6.777
-4.784
-41.38%
jan 1, 2007
6.867
+0.09
1.33%
jan 1, 2008
8.178
+1.31
19.08%
jan 1, 2009
4.756
-3.422
-41.84%
jan 1, 2010
3.212
-1.544
-32.46%
jan 1, 2011
6.525
+3.313
103.14%
jan 1, 2012
5.264
-1.261
-19.33%
jan 1, 2013
3.866
-1.398
-26.55%
jan 1, 2014
1.607
-2.259
-58.43%
jan 1, 2015
1.836
+0.228
14.21%
Ranking of countries by current statistics by years


Comments: