29
/
en
AIzaSyAYiBZKx7MnpbEhh9jyipgxe19OcubqV5w
April 1, 2024
83472
Belize
BLZ
true
2
1
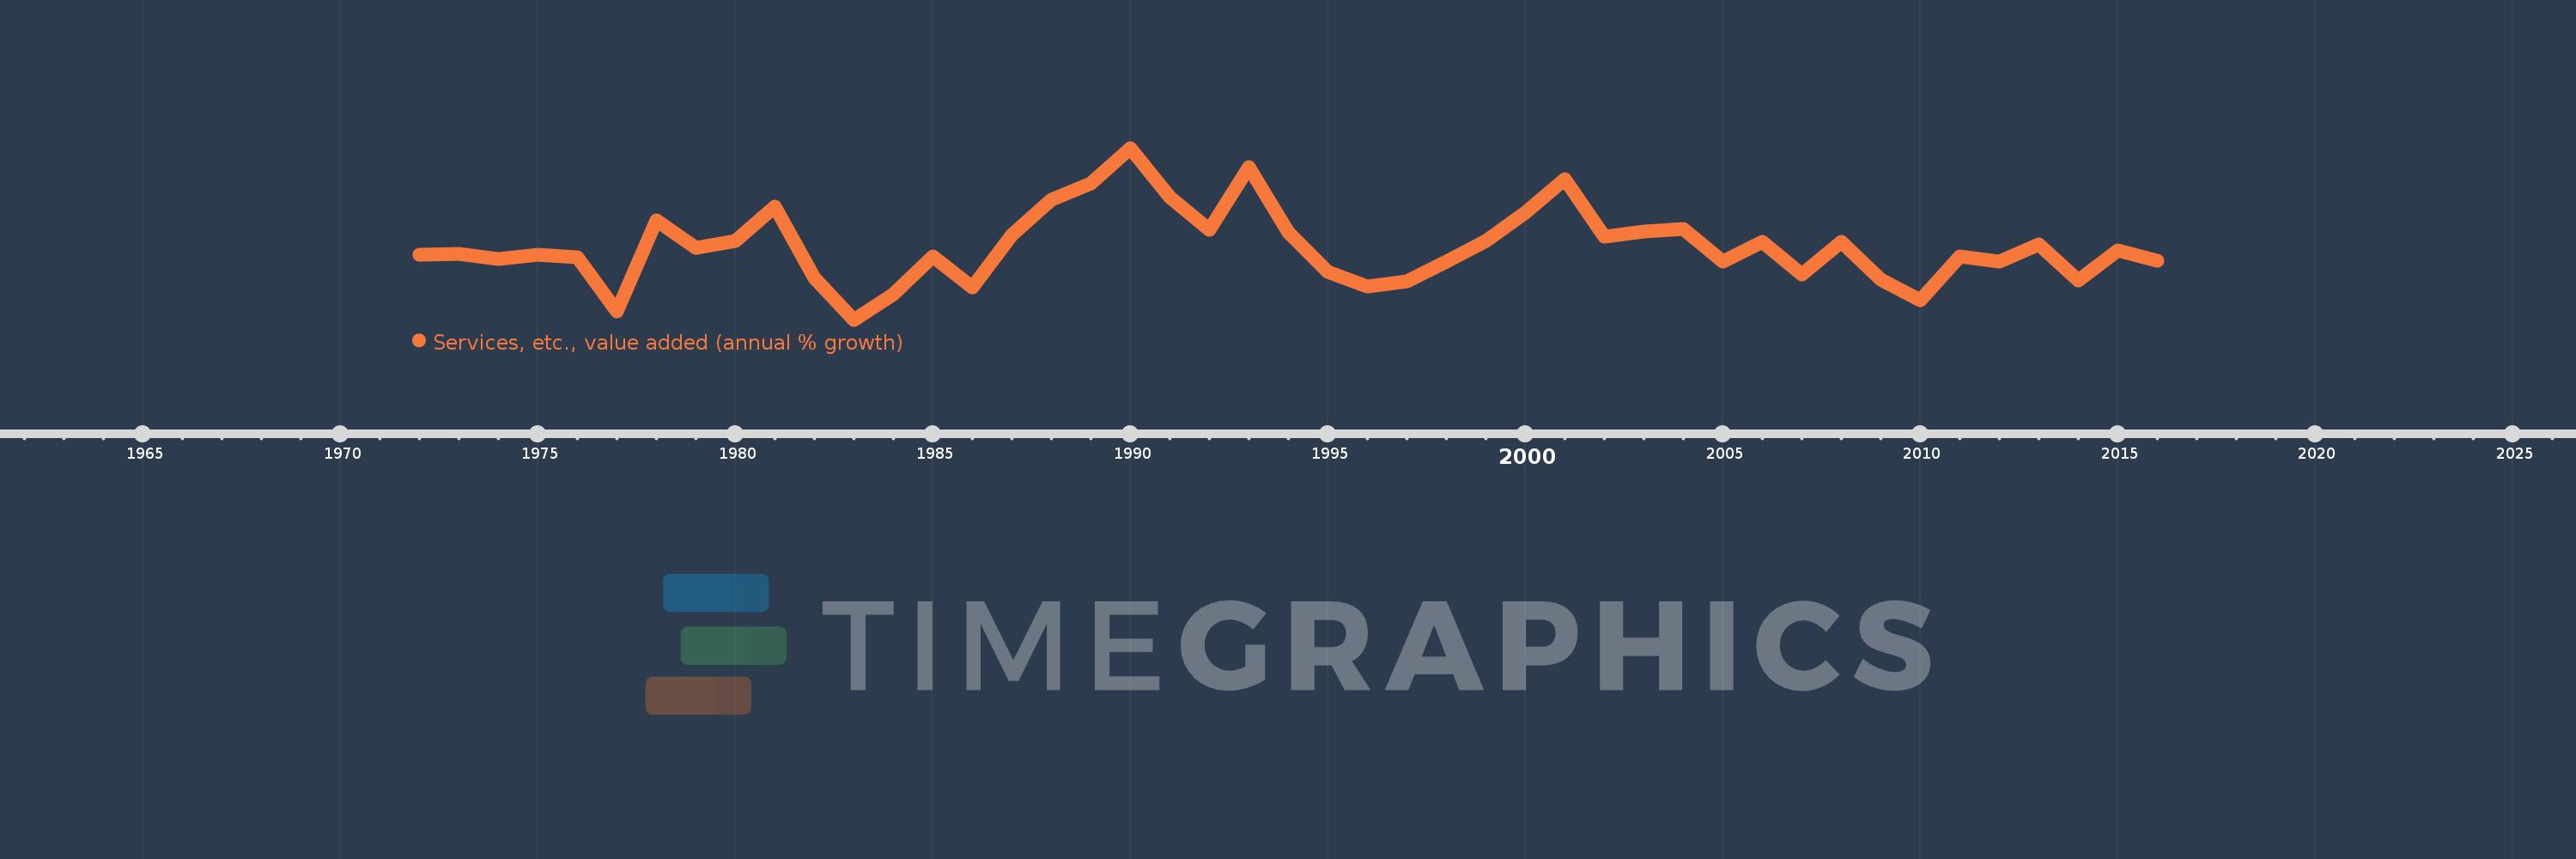
Services, etc., value added (annual % growth)
2016,2015,2014,2013,2012,2011,2010,2009,2008,2007,2006,2005,2004,2003,2002,2001,2000,1999,1998,1997,1996,1995,1994,1993,1992,1991,1990,1989,1988,1987,1986,1985,1984,1983,1982,1981,1980,1979,1978,1977,1976,1975,1974,1973,1972
This statistics in other country:
AfghanistanAlbaniaAlgeriaAntigua and BarbudaArab WorldArgentinaArmeniaAustraliaAustriaAzerbaijanBahamas, TheBahrainBangladeshBelarusBelgiumBelizeBeninBermudaBhutanBoliviaBosnia and HerzegovinaBotswanaBrazilBrunei DarussalamBulgariaBurkina FasoBurundiCabo VerdeCambodiaCameroonCanadaCaribbean small statesCentral African RepublicCentral Europe and the BalticsChadChileChinaColombiaComorosCongo, Dem. Rep.Congo, Rep.Costa RicaCote d'IvoireCroatiaCubaCyprusCzech RepublicDenmarkDjiboutiDominicaDominican RepublicEarly-demographic dividendEast Asia & PacificEast Asia & Pacific (excluding high income)East Asia & Pacific (IDA & IBRD countries)EcuadorEgypt, Arab Rep.El SalvadorEquatorial GuineaEritreaEstoniaEthiopiaEuro areaEurope & Central AsiaEurope & Central Asia (excluding high income)Europe & Central Asia (IDA & IBRD countries)European UnionFijiFinlandFragile and conflict affected situationsFranceGabonGambia, TheGeorgiaGermanyGhanaGreeceGrenadaGuatemalaGuineaGuinea-BissauGuyanaHaitiHeavily indebted poor countries (HIPC)High incomeHondurasHong Kong SAR, ChinaHungaryIBRD onlyIcelandIDA & IBRD totalIDA blendIDA onlyIDA totalIndiaIndonesiaIran, Islamic Rep.IraqIrelandItalyJamaicaJapanJordanKazakhstanKenyaKiribatiKorea, Rep.KosovoKuwaitKyrgyz RepublicLao PDRLate-demographic dividendLatin America & Caribbean Latin America & Caribbean (excluding high income)Latin America & the Caribbean (IDA & IBRD countries)LatviaLeast developed countries: UN classificationLebanonLesothoLiberiaLithuaniaLow & middle incomeLow incomeLower middle incomeLuxembourgMacedonia, FYRMadagascarMalawiMalaysiaMaldivesMaliMarshall IslandsMauritaniaMauritiusMexicoMicronesia, Fed. Sts.Middle East & North AfricaMiddle East & North Africa (excluding high income)Middle East & North Africa (IDA & IBRD countries)Middle incomeMoldovaMongoliaMontenegroMoroccoMozambiqueMyanmarNamibiaNepalNetherlandsNew ZealandNicaraguaNigerNigeriaNorth AmericaNorwayOECD membersOmanOther small statesPacific island small statesPakistanPalauPanamaPapua New GuineaParaguayPeruPhilippinesPolandPortugalPost-demographic dividendPre-demographic dividendPuerto RicoQatarRomaniaRussian FederationRwandaSamoaSao Tome and PrincipeSaudi ArabiaSenegalSerbiaSeychellesSierra LeoneSingaporeSlovak RepublicSloveniaSmall statesSolomon IslandsSomaliaSouth AfricaSouth AsiaSouth Asia (IDA & IBRD)SpainSri LankaSt. Kitts and NevisSt. LuciaSt. Vincent and the GrenadinesSub-Saharan Africa Sub-Saharan Africa (excluding high income)Sub-Saharan Africa (IDA & IBRD countries)SudanSurinameSwazilandSwedenSwitzerlandSyrian Arab RepublicTajikistanTanzaniaThailandTimor-LesteTogoTongaTrinidad and TobagoTunisiaTurkeyTurkmenistanTuvaluUgandaUkraineUnited Arab EmiratesUnited KingdomUnited StatesUpper middle incomeUruguayUzbekistanVanuatuVenezuela, RBVietnamWest Bank and GazaWorldZambiaZimbabwe Timeline:
This timeline shows a graph from 1972 to 2016 of Belize. No data until 1971. Number of actual observations by date: 45.
Source name:
World Development Indicators
Source organization:
World Bank national accounts data, and OECD National Accounts data files.
Categories, topics:
Economy & Growth
Last updated:
apr 23, 2017
Indicators value changes by year
Minimum:
-2.408
jan 1, 1983
Maximum:
14.253
jan 1, 1990
At the date of observation
Value
Absolute change
Change from previous value
jan 1, 1972
3.867
+3.867
0.0%
jan 1, 1973
4.015
+0.148
3.83%
jan 1, 1974
3.509
-0.506
-12.6%
jan 1, 1975
3.864
+0.356
10.14%
jan 1, 1976
3.655
-0.209
-5.41%
jan 1, 1977
-1.574
-5.23
-143.07%
jan 1, 1978
7.23
+8.804
-559.23%
jan 1, 1979
4.594
-2.635
-36.45%
jan 1, 1980
5.191
+0.597
12.99%
jan 1, 1981
8.568
+3.377
65.06%
jan 1, 1982
1.648
-6.92
-80.76%
jan 1, 1983
-2.408
-4.056
-246.08%
jan 1, 1984
0.05
+2.458
-102.09%
jan 1, 1985
3.724
+3.674
7.3K%
jan 1, 1986
0.728
-2.996
-80.46%
jan 1, 1987
5.829
+5.101
700.87%
jan 1, 1988
9.194
+3.366
57.75%
jan 1, 1989
10.838
+1.644
17.88%
jan 1, 1990
14.253
+3.416
31.52%
jan 1, 1991
9.513
-4.741
-33.26%
jan 1, 1992
6.276
-3.237
-34.02%
jan 1, 1993
12.402
+6.126
97.61%
jan 1, 1994
6.089
-6.313
-50.9%
jan 1, 1995
2.266
-3.823
-62.79%
jan 1, 1996
0.791
-1.474
-65.08%
jan 1, 1997
1.357
+0.566
71.56%
jan 1, 1998
3.27
+1.912
140.89%
jan 1, 1999
5.201
+1.932
59.08%
jan 1, 2000
7.939
+2.738
52.64%
jan 1, 2001
11.201
+3.262
41.09%
jan 1, 2002
5.676
-5.525
-49.33%
jan 1, 2003
6.182
+0.506
8.91%
jan 1, 2004
6.395
+0.213
3.44%
jan 1, 2005
3.217
-3.177
-49.69%
jan 1, 2006
5.117
+1.9
59.06%
jan 1, 2007
1.96
-3.157
-61.7%
jan 1, 2008
5.166
+3.207
163.61%
jan 1, 2009
1.473
-3.694
-71.49%
jan 1, 2010
-0.513
-1.986
-134.83%
jan 1, 2011
3.695
+4.208
-820.2%
jan 1, 2012
3.245
-0.449
-12.16%
jan 1, 2013
4.861
+1.615
49.78%
jan 1, 2014
1.377
-3.484
-71.67%
jan 1, 2015
4.315
+2.938
213.39%
jan 1, 2016
3.353
-0.962
-22.29%
Ranking of countries by current statistics by years


Comments: