29
/
en
AIzaSyAYiBZKx7MnpbEhh9jyipgxe19OcubqV5w
April 1, 2024
203613
Mozambique
MOZ
true
2
1
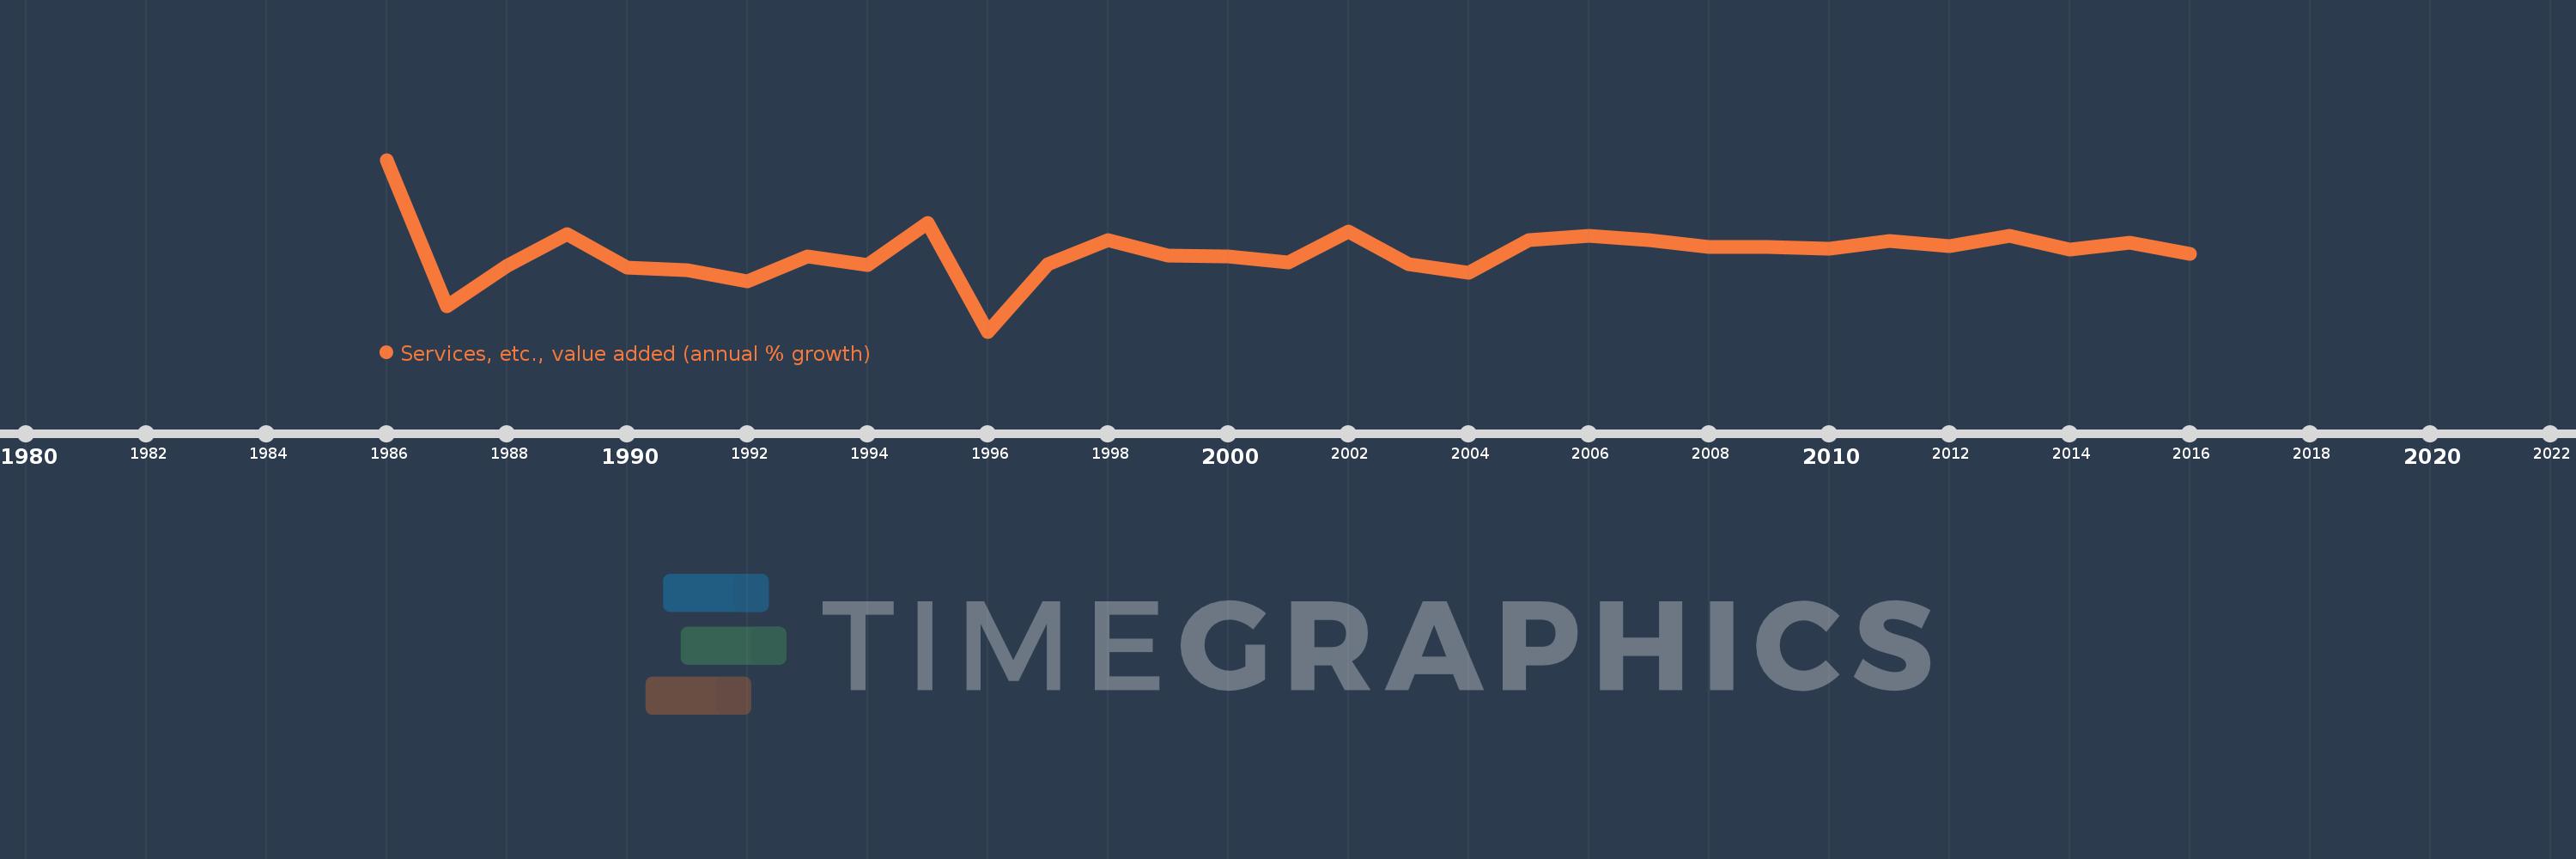
Services, etc., value added (annual % growth)
2016,2015,2014,2013,2012,2011,2010,2009,2008,2007,2006,2005,2004,2003,2002,2001,2000,1999,1998,1997,1996,1995,1994,1993,1992,1991,1990,1989,1988,1987,1986
This statistics in other country:
AfghanistanAlbaniaAlgeriaAntigua and BarbudaArab WorldArgentinaArmeniaAustraliaAustriaAzerbaijanBahamas, TheBahrainBangladeshBelarusBelgiumBelizeBeninBermudaBhutanBoliviaBosnia and HerzegovinaBotswanaBrazilBrunei DarussalamBulgariaBurkina FasoBurundiCabo VerdeCambodiaCameroonCanadaCaribbean small statesCentral African RepublicCentral Europe and the BalticsChadChileChinaColombiaComorosCongo, Dem. Rep.Congo, Rep.Costa RicaCote d'IvoireCroatiaCubaCyprusCzech RepublicDenmarkDjiboutiDominicaDominican RepublicEarly-demographic dividendEast Asia & PacificEast Asia & Pacific (excluding high income)East Asia & Pacific (IDA & IBRD countries)EcuadorEgypt, Arab Rep.El SalvadorEquatorial GuineaEritreaEstoniaEthiopiaEuro areaEurope & Central AsiaEurope & Central Asia (excluding high income)Europe & Central Asia (IDA & IBRD countries)European UnionFijiFinlandFragile and conflict affected situationsFranceGabonGambia, TheGeorgiaGermanyGhanaGreeceGrenadaGuatemalaGuineaGuinea-BissauGuyanaHaitiHeavily indebted poor countries (HIPC)High incomeHondurasHong Kong SAR, ChinaHungaryIBRD onlyIcelandIDA & IBRD totalIDA blendIDA onlyIDA totalIndiaIndonesiaIran, Islamic Rep.IraqIrelandItalyJamaicaJapanJordanKazakhstanKenyaKiribatiKorea, Rep.KosovoKuwaitKyrgyz RepublicLao PDRLate-demographic dividendLatin America & Caribbean Latin America & Caribbean (excluding high income)Latin America & the Caribbean (IDA & IBRD countries)LatviaLeast developed countries: UN classificationLebanonLesothoLiberiaLithuaniaLow & middle incomeLow incomeLower middle incomeLuxembourgMacedonia, FYRMadagascarMalawiMalaysiaMaldivesMaliMarshall IslandsMauritaniaMauritiusMexicoMicronesia, Fed. Sts.Middle East & North AfricaMiddle East & North Africa (excluding high income)Middle East & North Africa (IDA & IBRD countries)Middle incomeMoldovaMongoliaMontenegroMoroccoMozambiqueMyanmarNamibiaNepalNetherlandsNew ZealandNicaraguaNigerNigeriaNorth AmericaNorwayOECD membersOmanOther small statesPacific island small statesPakistanPalauPanamaPapua New GuineaParaguayPeruPhilippinesPolandPortugalPost-demographic dividendPre-demographic dividendPuerto RicoQatarRomaniaRussian FederationRwandaSamoaSao Tome and PrincipeSaudi ArabiaSenegalSerbiaSeychellesSierra LeoneSingaporeSlovak RepublicSloveniaSmall statesSolomon IslandsSomaliaSouth AfricaSouth AsiaSouth Asia (IDA & IBRD)SpainSri LankaSt. Kitts and NevisSt. LuciaSt. Vincent and the GrenadinesSub-Saharan Africa Sub-Saharan Africa (excluding high income)Sub-Saharan Africa (IDA & IBRD countries)SudanSurinameSwazilandSwedenSwitzerlandSyrian Arab RepublicTajikistanTanzaniaThailandTimor-LesteTogoTongaTrinidad and TobagoTunisiaTurkeyTurkmenistanTuvaluUgandaUkraineUnited Arab EmiratesUnited KingdomUnited StatesUpper middle incomeUruguayUzbekistanVanuatuVenezuela, RBVietnamWest Bank and GazaWorldZambiaZimbabwe Timeline:
This timeline shows a graph from 1986 to 2016 of Mozambique. No data until 1985. Number of actual observations by date: 31.
Source name:
World Development Indicators
Source organization:
World Bank national accounts data, and OECD National Accounts data files.
Categories, topics:
Economy & Growth
Last updated:
apr 23, 2017
Indicators value changes by year
Minimum:
-6.909
jan 1, 1996
Maximum:
23.819
jan 1, 1986
At the date of observation
Value
Absolute change
Change from previous value
jan 1, 1986
23.819
+23.819
0.0%
jan 1, 1987
-2.449
-26.268
-110.28%
jan 1, 1988
4.916
+7.365
-300.76%
jan 1, 1989
10.517
+5.601
113.92%
jan 1, 1990
4.588
-5.929
-56.37%
jan 1, 1991
4.147
-0.441
-9.62%
jan 1, 1992
2.08
-2.067
-49.84%
jan 1, 1993
6.474
+4.393
211.17%
jan 1, 1994
5.008
-1.466
-22.65%
jan 1, 1995
12.5
+7.492
149.61%
jan 1, 1996
-6.909
-19.408
-155.27%
jan 1, 1997
5.164
+12.073
-174.75%
jan 1, 1998
9.447
+4.282
82.92%
jan 1, 1999
6.76
-2.687
-28.44%
jan 1, 2000
6.585
-0.174
-2.58%
jan 1, 2001
5.46
-1.125
-17.08%
jan 1, 2002
11.03
+5.569
101.99%
jan 1, 2003
5.206
-5.824
-52.8%
jan 1, 2004
3.679
-1.527
-29.34%
jan 1, 2005
9.435
+5.756
156.48%
jan 1, 2006
10.197
+0.762
8.07%
jan 1, 2007
9.485
-0.712
-6.98%
jan 1, 2008
8.272
-1.213
-12.79%
jan 1, 2009
8.289
+0.017
0.21%
jan 1, 2010
7.884
-0.406
-4.89%
jan 1, 2011
9.302
+1.418
17.99%
jan 1, 2012
8.398
-0.904
-9.72%
jan 1, 2013
10.268
+1.87
22.27%
jan 1, 2014
7.827
-2.441
-23.78%
jan 1, 2015
8.995
+1.168
14.93%
jan 1, 2016
7.018
-1.977
-21.98%
Ranking of countries by current statistics by years


Comments: