29
/
en
AIzaSyAYiBZKx7MnpbEhh9jyipgxe19OcubqV5w
April 1, 2024
37794
IDA & IBRD total
IBT
false
2
1
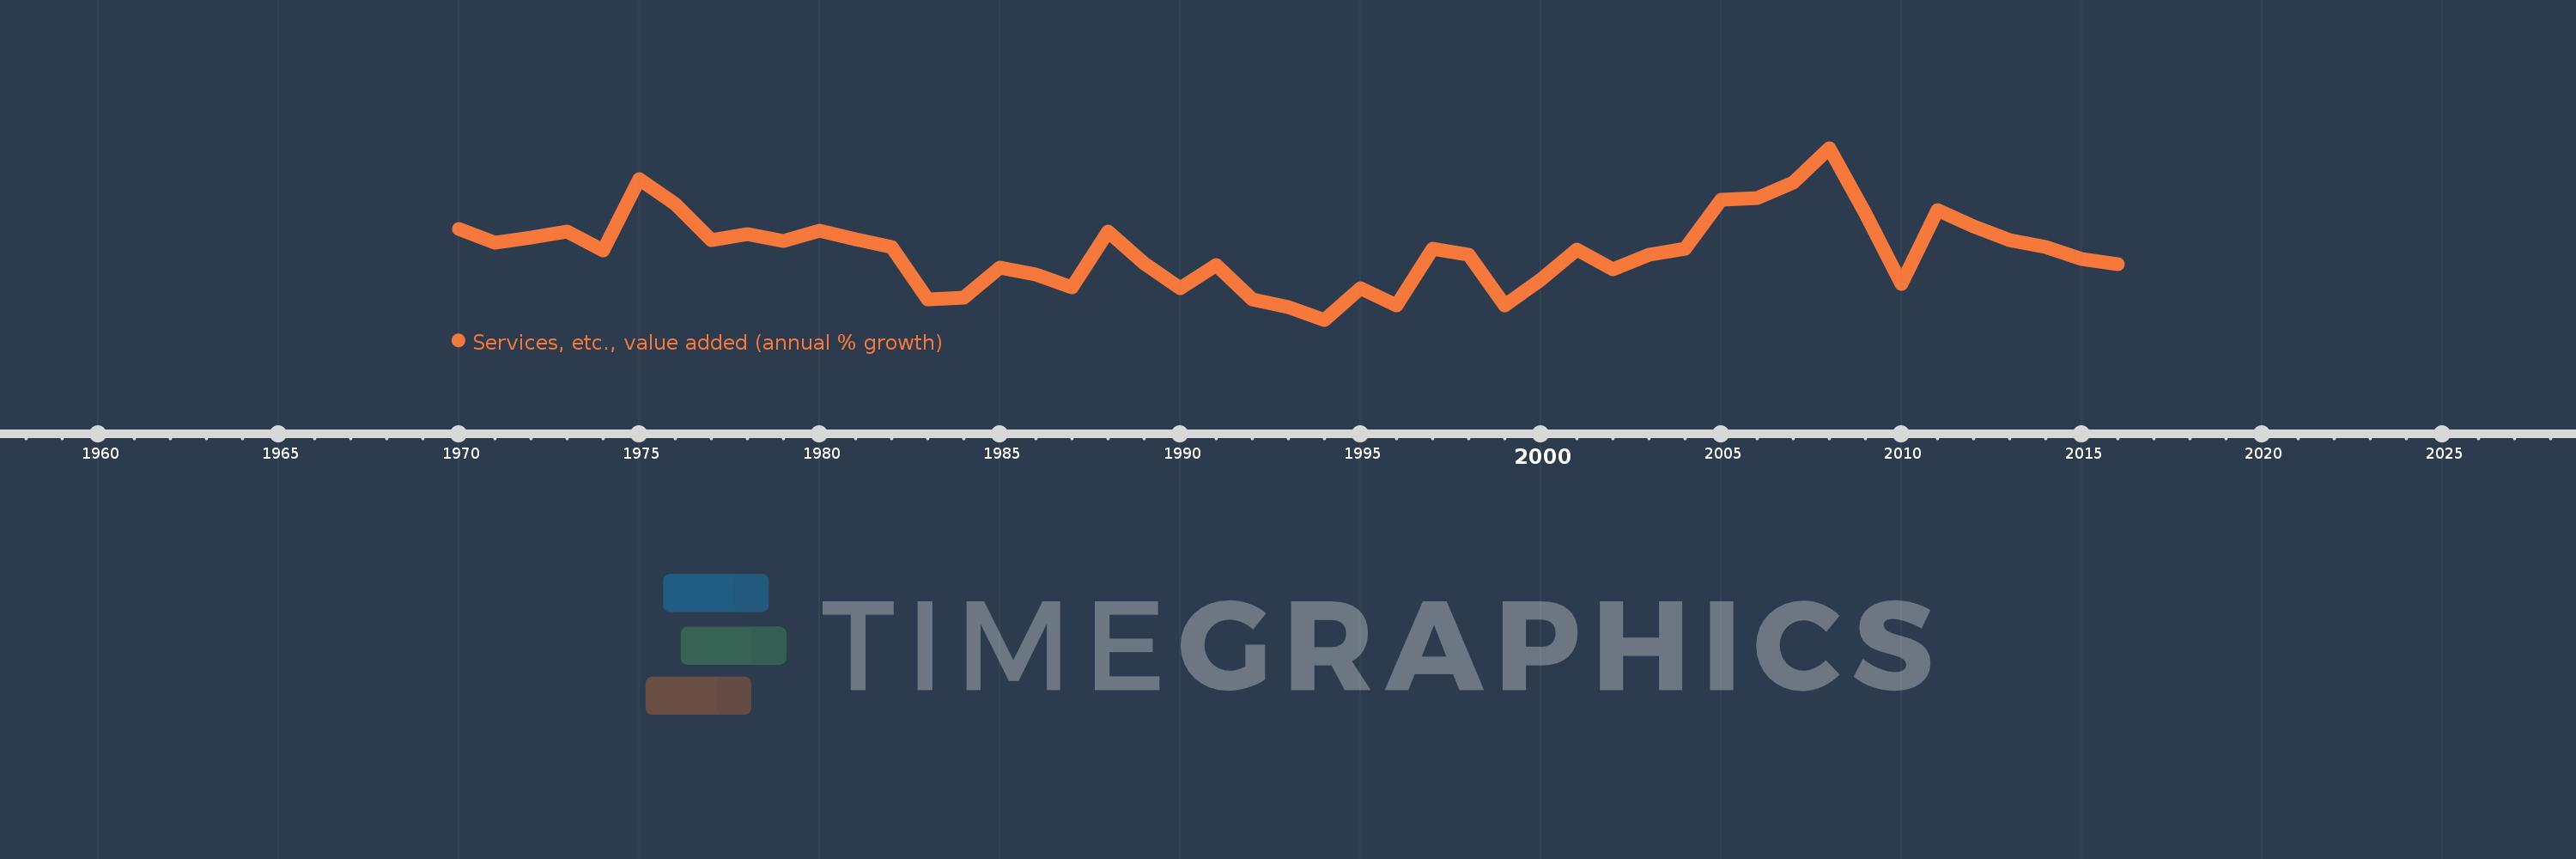
Services, etc., value added (annual % growth)
2016,2015,2014,2013,2012,2011,2010,2009,2008,2007,2006,2005,2004,2003,2002,2001,2000,1999,1998,1997,1996,1995,1994,1993,1992,1991,1990,1989,1988,1987,1986,1985,1984,1983,1982,1981,1980,1979,1978,1977,1976,1975,1974,1973,1972,1971,1970
This statistics in other country:
AfghanistanAlbaniaAlgeriaAntigua and BarbudaArab WorldArgentinaArmeniaAustraliaAustriaAzerbaijanBahamas, TheBahrainBangladeshBelarusBelgiumBelizeBeninBermudaBhutanBoliviaBosnia and HerzegovinaBotswanaBrazilBrunei DarussalamBulgariaBurkina FasoBurundiCabo VerdeCambodiaCameroonCanadaCaribbean small statesCentral African RepublicCentral Europe and the BalticsChadChileChinaColombiaComorosCongo, Dem. Rep.Congo, Rep.Costa RicaCote d'IvoireCroatiaCubaCyprusCzech RepublicDenmarkDjiboutiDominicaDominican RepublicEarly-demographic dividendEast Asia & PacificEast Asia & Pacific (excluding high income)East Asia & Pacific (IDA & IBRD countries)EcuadorEgypt, Arab Rep.El SalvadorEquatorial GuineaEritreaEstoniaEthiopiaEuro areaEurope & Central AsiaEurope & Central Asia (excluding high income)Europe & Central Asia (IDA & IBRD countries)European UnionFijiFinlandFragile and conflict affected situationsFranceGabonGambia, TheGeorgiaGermanyGhanaGreeceGrenadaGuatemalaGuineaGuinea-BissauGuyanaHaitiHeavily indebted poor countries (HIPC)High incomeHondurasHong Kong SAR, ChinaHungaryIBRD onlyIcelandIDA & IBRD totalIDA blendIDA onlyIDA totalIndiaIndonesiaIran, Islamic Rep.IraqIrelandItalyJamaicaJapanJordanKazakhstanKenyaKiribatiKorea, Rep.KosovoKuwaitKyrgyz RepublicLao PDRLate-demographic dividendLatin America & Caribbean Latin America & Caribbean (excluding high income)Latin America & the Caribbean (IDA & IBRD countries)LatviaLeast developed countries: UN classificationLebanonLesothoLiberiaLithuaniaLow & middle incomeLow incomeLower middle incomeLuxembourgMacedonia, FYRMadagascarMalawiMalaysiaMaldivesMaliMarshall IslandsMauritaniaMauritiusMexicoMicronesia, Fed. Sts.Middle East & North AfricaMiddle East & North Africa (excluding high income)Middle East & North Africa (IDA & IBRD countries)Middle incomeMoldovaMongoliaMontenegroMoroccoMozambiqueMyanmarNamibiaNepalNetherlandsNew ZealandNicaraguaNigerNigeriaNorth AmericaNorwayOECD membersOmanOther small statesPacific island small statesPakistanPalauPanamaPapua New GuineaParaguayPeruPhilippinesPolandPortugalPost-demographic dividendPre-demographic dividendPuerto RicoQatarRomaniaRussian FederationRwandaSamoaSao Tome and PrincipeSaudi ArabiaSenegalSerbiaSeychellesSierra LeoneSingaporeSlovak RepublicSloveniaSmall statesSolomon IslandsSomaliaSouth AfricaSouth AsiaSouth Asia (IDA & IBRD)SpainSri LankaSt. Kitts and NevisSt. LuciaSt. Vincent and the GrenadinesSub-Saharan Africa Sub-Saharan Africa (excluding high income)Sub-Saharan Africa (IDA & IBRD countries)SudanSurinameSwazilandSwedenSwitzerlandSyrian Arab RepublicTajikistanTanzaniaThailandTimor-LesteTogoTongaTrinidad and TobagoTunisiaTurkeyTurkmenistanTuvaluUgandaUkraineUnited Arab EmiratesUnited KingdomUnited StatesUpper middle incomeUruguayUzbekistanVanuatuVenezuela, RBVietnamWest Bank and GazaWorldZambiaZimbabwe Timeline:
This timeline shows a graph from 1970 to 2016 of IDA & IBRD total. No data until 1969. Number of actual observations by date: 47.
Source name:
World Development Indicators
Source organization:
World Bank national accounts data, and OECD National Accounts data files.
Categories, topics:
Economy & Growth
Last updated:
apr 23, 2017
Indicators value changes by year
Maximum:
10.052
jan 1, 2008
At the date of observation
Value
Absolute change
Change from previous value
jan 1, 1970
6.049
+6.049
0.0%
jan 1, 1971
5.392
-0.657
-10.86%
jan 1, 1972
5.623
+0.231
4.29%
jan 1, 1973
5.923
+0.299
5.33%
jan 1, 1974
5.014
-0.908
-15.34%
jan 1, 1975
8.53
+3.516
70.11%
jan 1, 1976
7.278
-1.252
-14.68%
jan 1, 1977
5.524
-1.754
-24.1%
jan 1, 1978
5.795
+0.271
4.9%
jan 1, 1979
5.469
-0.326
-5.62%
jan 1, 1980
5.953
+0.484
8.85%
jan 1, 1981
5.546
-0.407
-6.83%
jan 1, 1982
5.164
-0.382
-6.89%
jan 1, 1983
2.575
-2.589
-50.13%
jan 1, 1984
2.673
+0.098
3.82%
jan 1, 1985
4.158
+1.484
55.52%
jan 1, 1986
3.803
-0.355
-8.53%
jan 1, 1987
3.183
-0.62
-16.3%
jan 1, 1988
5.933
+2.749
86.37%
jan 1, 1989
4.349
-1.583
-26.69%
jan 1, 1990
3.144
-1.206
-27.72%
jan 1, 1991
4.272
+1.128
35.89%
jan 1, 1992
2.582
-1.69
-39.56%
jan 1, 1993
2.213
-0.369
-14.31%
jan 1, 1994
1.578
-0.634
-28.67%
jan 1, 1995
3.136
+1.558
98.74%
jan 1, 1996
2.294
-0.843
-26.86%
jan 1, 1997
5.064
+2.77
120.76%
jan 1, 1998
4.794
-0.27
-5.33%
jan 1, 1999
2.275
-2.519
-52.54%
jan 1, 2000
3.574
+1.298
57.05%
jan 1, 2001
5.041
+1.467
41.05%
jan 1, 2002
4.052
-0.989
-19.62%
jan 1, 2003
4.788
+0.736
18.16%
jan 1, 2004
5.065
+0.278
5.8%
jan 1, 2005
7.517
+2.452
48.4%
jan 1, 2006
7.598
+0.081
1.08%
jan 1, 2007
8.335
+0.737
9.7%
jan 1, 2008
10.052
+1.717
20.6%
jan 1, 2009
6.819
-3.233
-32.17%
jan 1, 2010
3.328
-3.491
-51.19%
jan 1, 2011
6.97
+3.642
109.41%
jan 1, 2012
6.187
-0.782
-11.23%
jan 1, 2013
5.486
-0.702
-11.34%
jan 1, 2014
5.155
-0.33
-6.02%
jan 1, 2015
4.571
-0.585
-11.34%
jan 1, 2016
4.312
-0.258
-5.65%
Ranking of countries by current statistics by years


Comments: