29
/
en
AIzaSyAYiBZKx7MnpbEhh9jyipgxe19OcubqV5w
April 1, 2024
151104
Honduras
HND
true
2
1
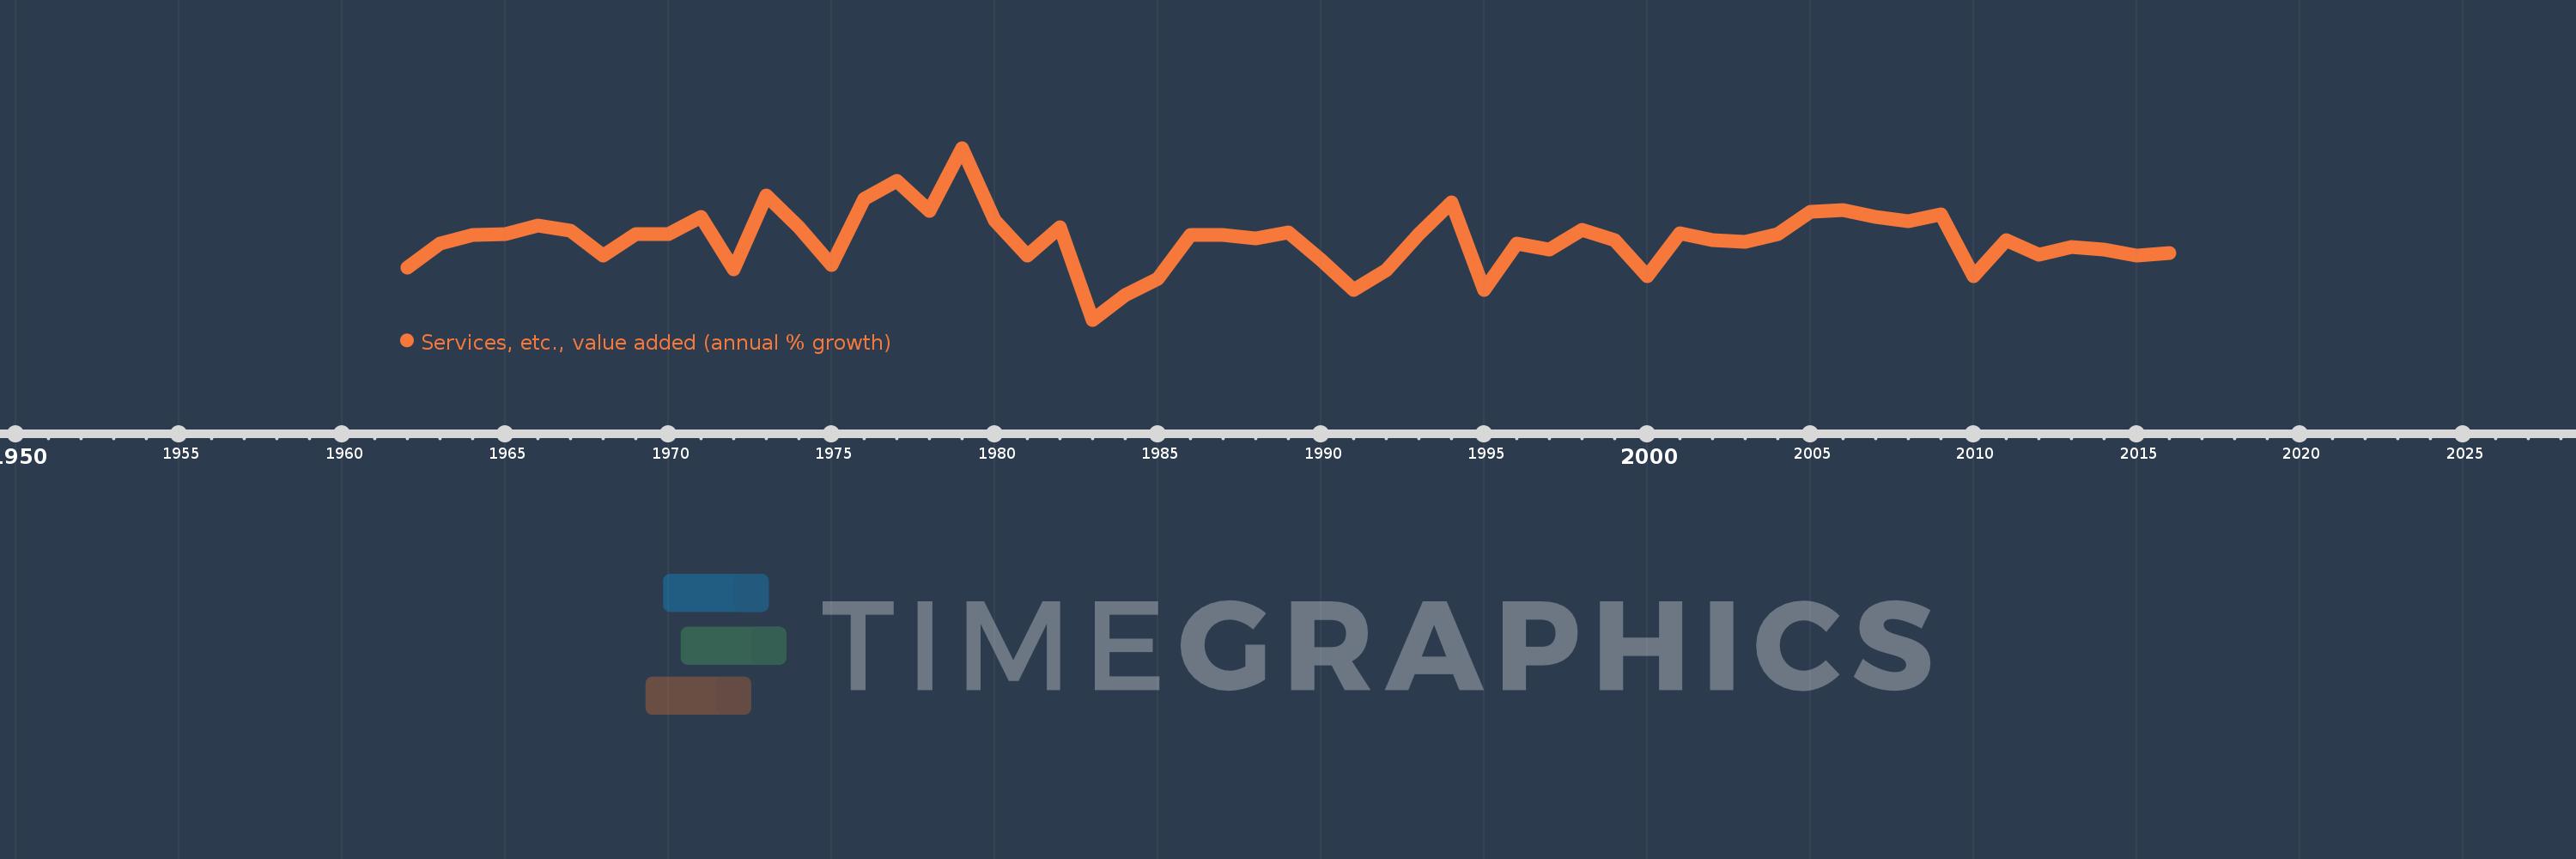
Services, etc., value added (annual % growth)
2016,2015,2014,2013,2012,2011,2010,2009,2008,2007,2006,2005,2004,2003,2002,2001,2000,1999,1998,1997,1996,1995,1994,1993,1992,1991,1990,1989,1988,1987,1986,1985,1984,1983,1982,1981,1980,1979,1978,1977,1976,1975,1974,1973,1972,1971,1970,1969,1968,1967,1966,1965,1964,1963,1962
This statistics in other country:
AfghanistanAlbaniaAlgeriaAntigua and BarbudaArab WorldArgentinaArmeniaAustraliaAustriaAzerbaijanBahamas, TheBahrainBangladeshBelarusBelgiumBelizeBeninBermudaBhutanBoliviaBosnia and HerzegovinaBotswanaBrazilBrunei DarussalamBulgariaBurkina FasoBurundiCabo VerdeCambodiaCameroonCanadaCaribbean small statesCentral African RepublicCentral Europe and the BalticsChadChileChinaColombiaComorosCongo, Dem. Rep.Congo, Rep.Costa RicaCote d'IvoireCroatiaCubaCyprusCzech RepublicDenmarkDjiboutiDominicaDominican RepublicEarly-demographic dividendEast Asia & PacificEast Asia & Pacific (excluding high income)East Asia & Pacific (IDA & IBRD countries)EcuadorEgypt, Arab Rep.El SalvadorEquatorial GuineaEritreaEstoniaEthiopiaEuro areaEurope & Central AsiaEurope & Central Asia (excluding high income)Europe & Central Asia (IDA & IBRD countries)European UnionFijiFinlandFragile and conflict affected situationsFranceGabonGambia, TheGeorgiaGermanyGhanaGreeceGrenadaGuatemalaGuineaGuinea-BissauGuyanaHaitiHeavily indebted poor countries (HIPC)High incomeHondurasHong Kong SAR, ChinaHungaryIBRD onlyIcelandIDA & IBRD totalIDA blendIDA onlyIDA totalIndiaIndonesiaIran, Islamic Rep.IraqIrelandItalyJamaicaJapanJordanKazakhstanKenyaKiribatiKorea, Rep.KosovoKuwaitKyrgyz RepublicLao PDRLate-demographic dividendLatin America & Caribbean Latin America & Caribbean (excluding high income)Latin America & the Caribbean (IDA & IBRD countries)LatviaLeast developed countries: UN classificationLebanonLesothoLiberiaLithuaniaLow & middle incomeLow incomeLower middle incomeLuxembourgMacedonia, FYRMadagascarMalawiMalaysiaMaldivesMaliMarshall IslandsMauritaniaMauritiusMexicoMicronesia, Fed. Sts.Middle East & North AfricaMiddle East & North Africa (excluding high income)Middle East & North Africa (IDA & IBRD countries)Middle incomeMoldovaMongoliaMontenegroMoroccoMozambiqueMyanmarNamibiaNepalNetherlandsNew ZealandNicaraguaNigerNigeriaNorth AmericaNorwayOECD membersOmanOther small statesPacific island small statesPakistanPalauPanamaPapua New GuineaParaguayPeruPhilippinesPolandPortugalPost-demographic dividendPre-demographic dividendPuerto RicoQatarRomaniaRussian FederationRwandaSamoaSao Tome and PrincipeSaudi ArabiaSenegalSerbiaSeychellesSierra LeoneSingaporeSlovak RepublicSloveniaSmall statesSolomon IslandsSomaliaSouth AfricaSouth AsiaSouth Asia (IDA & IBRD)SpainSri LankaSt. Kitts and NevisSt. LuciaSt. Vincent and the GrenadinesSub-Saharan Africa Sub-Saharan Africa (excluding high income)Sub-Saharan Africa (IDA & IBRD countries)SudanSurinameSwazilandSwedenSwitzerlandSyrian Arab RepublicTajikistanTanzaniaThailandTimor-LesteTogoTongaTrinidad and TobagoTunisiaTurkeyTurkmenistanTuvaluUgandaUkraineUnited Arab EmiratesUnited KingdomUnited StatesUpper middle incomeUruguayUzbekistanVanuatuVenezuela, RBVietnamWest Bank and GazaWorldZambiaZimbabwe Timeline:
This timeline shows a graph from 1962 to 2016 of Honduras. No data until 1961. Number of actual observations by date: 55.
Source name:
World Development Indicators
Source organization:
World Bank national accounts data, and OECD National Accounts data files.
Categories, topics:
Economy & Growth
Last updated:
apr 23, 2017
Indicators value changes by year
Minimum:
-4.141
jan 1, 1983
Maximum:
14.423
jan 1, 1979
At the date of observation
Value
Absolute change
Change from previous value
jan 1, 1962
1.482
+1.482
0.0%
jan 1, 1963
4.067
+2.585
174.34%
jan 1, 1964
5.025
+0.958
23.55%
jan 1, 1965
5.103
+0.079
1.56%
jan 1, 1966
6.084
+0.981
19.22%
jan 1, 1967
5.503
-0.581
-9.55%
jan 1, 1968
2.75
-2.753
-50.03%
jan 1, 1969
5.089
+2.339
85.05%
jan 1, 1970
5.082
-0.007
-0.14%
jan 1, 1971
6.964
+1.882
37.04%
jan 1, 1972
1.277
-5.687
-81.67%
jan 1, 1973
9.244
+7.967
624.09%
jan 1, 1974
5.865
-3.378
-36.55%
jan 1, 1975
1.726
-4.14
-70.58%
jan 1, 1976
8.929
+7.203
417.39%
jan 1, 1977
10.902
+1.973
22.1%
jan 1, 1978
7.613
-3.289
-30.17%
jan 1, 1979
14.423
+6.81
89.46%
jan 1, 1980
6.603
-7.82
-54.22%
jan 1, 1981
2.759
-3.844
-58.21%
jan 1, 1982
5.863
+3.104
112.5%
jan 1, 1983
-4.141
-10.004
-170.63%
jan 1, 1984
-1.458
+2.683
-64.79%
jan 1, 1985
0.329
+1.787
-122.55%
jan 1, 1986
5.025
+4.696
1.43K%
jan 1, 1987
5.044
+0.02
0.39%
jan 1, 1988
4.653
-0.391
-7.75%
jan 1, 1989
5.345
+0.692
14.87%
jan 1, 1990
2.335
-3.01
-56.32%
jan 1, 1991
-0.878
-3.213
-137.58%
jan 1, 1992
1.239
+2.117
-241.24%
jan 1, 1993
5.072
+3.833
309.21%
jan 1, 1994
8.573
+3.5
69.01%
jan 1, 1995
-0.92
-9.493
-110.73%
jan 1, 1996
4.101
+5.02
-545.77%
jan 1, 1997
3.419
-0.682
-16.63%
jan 1, 1998
5.57
+2.151
62.91%
jan 1, 1999
4.459
-1.111
-19.94%
jan 1, 2000
0.521
-3.937
-88.31%
jan 1, 2001
5.251
+4.73
907.21%
jan 1, 2002
4.485
-0.766
-14.59%
jan 1, 2003
4.317
-0.168
-3.75%
jan 1, 2004
5.122
+0.805
18.65%
jan 1, 2005
7.571
+2.449
47.81%
jan 1, 2006
7.687
+0.116
1.53%
jan 1, 2007
7.012
-0.675
-8.79%
jan 1, 2008
6.503
-0.509
-7.25%
jan 1, 2009
7.208
+0.705
10.84%
jan 1, 2010
0.588
-6.62
-91.84%
jan 1, 2011
4.498
+3.91
665.03%
jan 1, 2012
2.884
-1.614
-35.87%
jan 1, 2013
3.761
+0.876
30.38%
jan 1, 2014
3.487
-0.273
-7.27%
jan 1, 2015
2.832
-0.655
-18.79%
jan 1, 2016
3.072
+0.241
8.5%
Ranking of countries by current statistics by years


Comments: