29
/
en
AIzaSyAYiBZKx7MnpbEhh9jyipgxe19OcubqV5w
April 1, 2024
239980
Sierra Leone
SLE
true
2
1
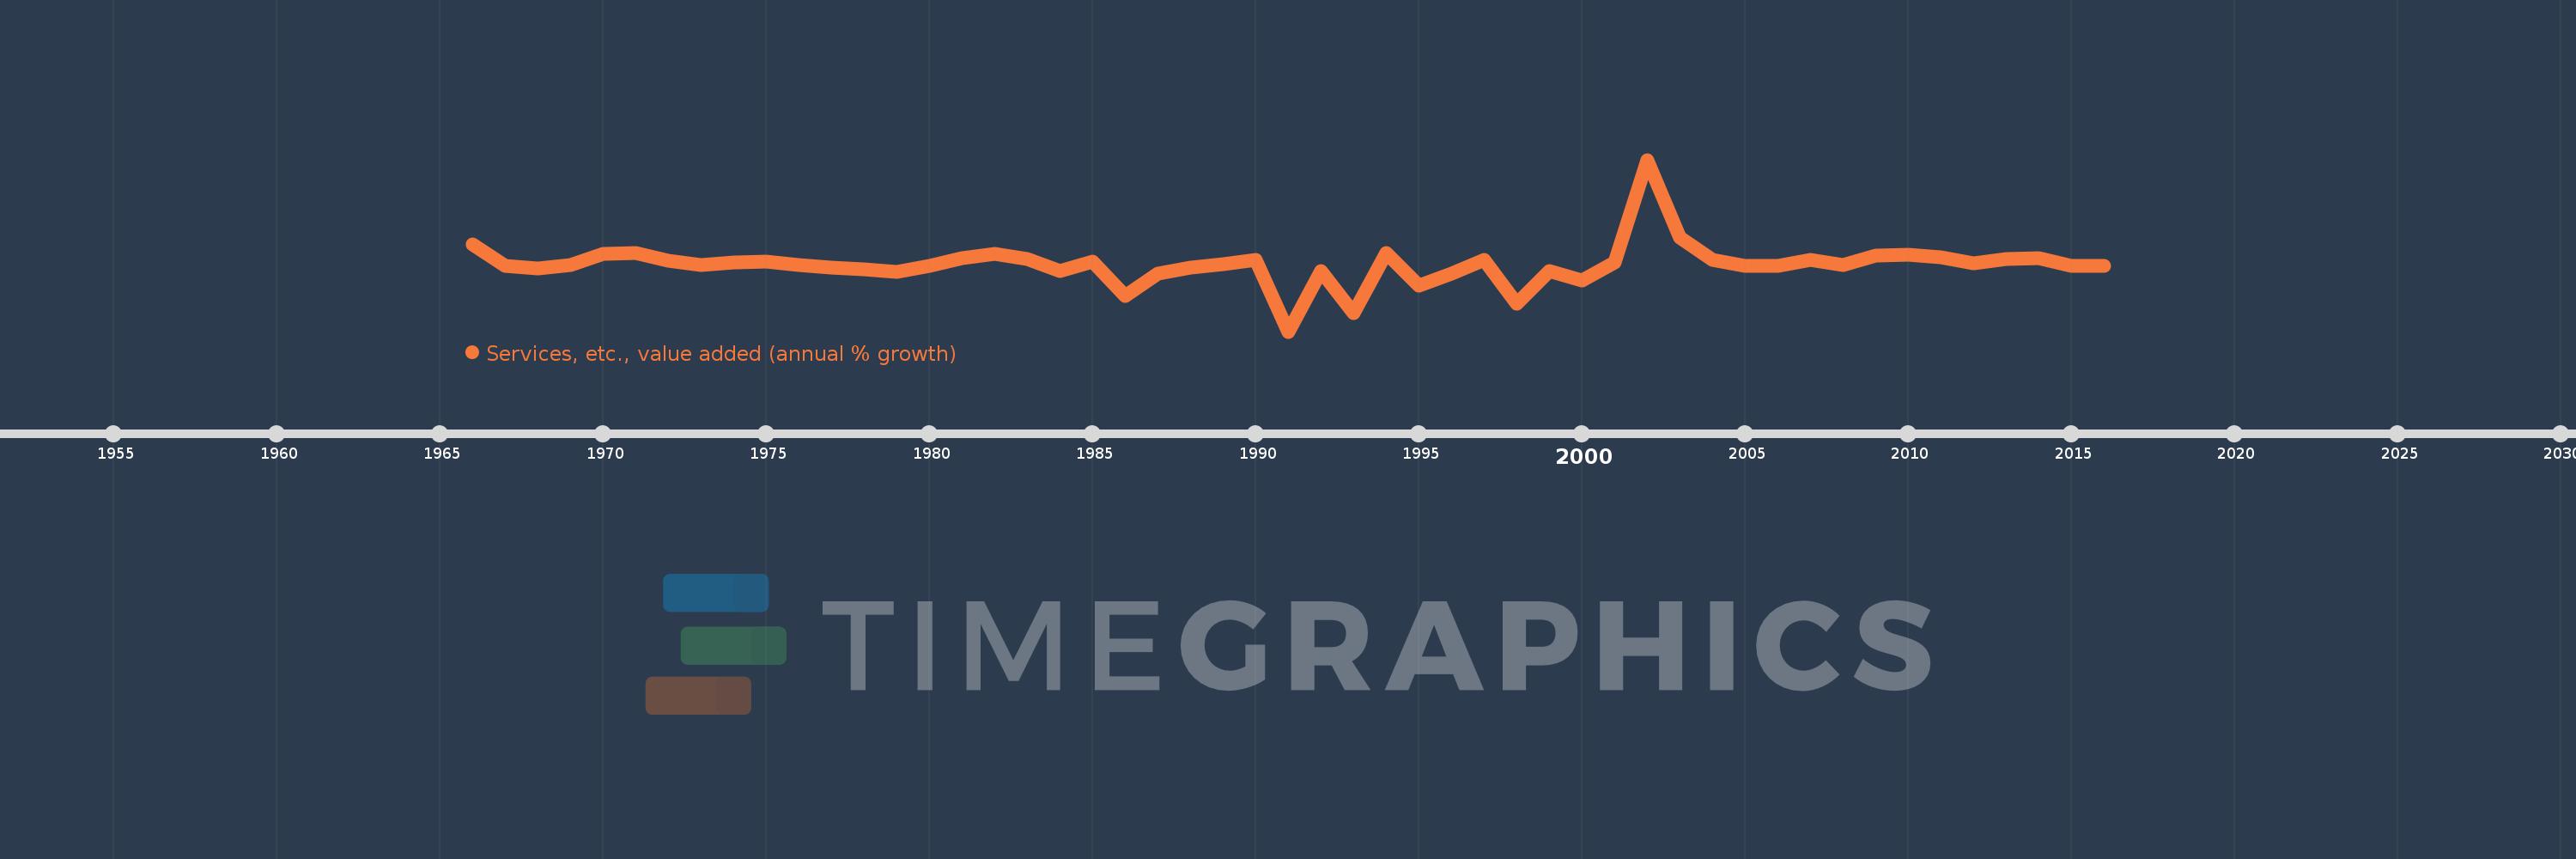
Services, etc., value added (annual % growth)
2016,2015,2014,2013,2012,2011,2010,2009,2008,2007,2006,2005,2004,2003,2002,2001,2000,1999,1998,1997,1996,1995,1994,1993,1992,1991,1990,1989,1988,1987,1986,1985,1984,1983,1982,1981,1980,1979,1978,1977,1976,1975,1974,1973,1972,1971,1970,1969,1968,1967,1966
This statistics in other country:
AfghanistanAlbaniaAlgeriaAntigua and BarbudaArab WorldArgentinaArmeniaAustraliaAustriaAzerbaijanBahamas, TheBahrainBangladeshBelarusBelgiumBelizeBeninBermudaBhutanBoliviaBosnia and HerzegovinaBotswanaBrazilBrunei DarussalamBulgariaBurkina FasoBurundiCabo VerdeCambodiaCameroonCanadaCaribbean small statesCentral African RepublicCentral Europe and the BalticsChadChileChinaColombiaComorosCongo, Dem. Rep.Congo, Rep.Costa RicaCote d'IvoireCroatiaCubaCyprusCzech RepublicDenmarkDjiboutiDominicaDominican RepublicEarly-demographic dividendEast Asia & PacificEast Asia & Pacific (excluding high income)East Asia & Pacific (IDA & IBRD countries)EcuadorEgypt, Arab Rep.El SalvadorEquatorial GuineaEritreaEstoniaEthiopiaEuro areaEurope & Central AsiaEurope & Central Asia (excluding high income)Europe & Central Asia (IDA & IBRD countries)European UnionFijiFinlandFragile and conflict affected situationsFranceGabonGambia, TheGeorgiaGermanyGhanaGreeceGrenadaGuatemalaGuineaGuinea-BissauGuyanaHaitiHeavily indebted poor countries (HIPC)High incomeHondurasHong Kong SAR, ChinaHungaryIBRD onlyIcelandIDA & IBRD totalIDA blendIDA onlyIDA totalIndiaIndonesiaIran, Islamic Rep.IraqIrelandItalyJamaicaJapanJordanKazakhstanKenyaKiribatiKorea, Rep.KosovoKuwaitKyrgyz RepublicLao PDRLate-demographic dividendLatin America & Caribbean Latin America & Caribbean (excluding high income)Latin America & the Caribbean (IDA & IBRD countries)LatviaLeast developed countries: UN classificationLebanonLesothoLiberiaLithuaniaLow & middle incomeLow incomeLower middle incomeLuxembourgMacedonia, FYRMadagascarMalawiMalaysiaMaldivesMaliMarshall IslandsMauritaniaMauritiusMexicoMicronesia, Fed. Sts.Middle East & North AfricaMiddle East & North Africa (excluding high income)Middle East & North Africa (IDA & IBRD countries)Middle incomeMoldovaMongoliaMontenegroMoroccoMozambiqueMyanmarNamibiaNepalNetherlandsNew ZealandNicaraguaNigerNigeriaNorth AmericaNorwayOECD membersOmanOther small statesPacific island small statesPakistanPalauPanamaPapua New GuineaParaguayPeruPhilippinesPolandPortugalPost-demographic dividendPre-demographic dividendPuerto RicoQatarRomaniaRussian FederationRwandaSamoaSao Tome and PrincipeSaudi ArabiaSenegalSerbiaSeychellesSierra LeoneSingaporeSlovak RepublicSloveniaSmall statesSolomon IslandsSomaliaSouth AfricaSouth AsiaSouth Asia (IDA & IBRD)SpainSri LankaSt. Kitts and NevisSt. LuciaSt. Vincent and the GrenadinesSub-Saharan Africa Sub-Saharan Africa (excluding high income)Sub-Saharan Africa (IDA & IBRD countries)SudanSurinameSwazilandSwedenSwitzerlandSyrian Arab RepublicTajikistanTanzaniaThailandTimor-LesteTogoTongaTrinidad and TobagoTunisiaTurkeyTurkmenistanTuvaluUgandaUkraineUnited Arab EmiratesUnited KingdomUnited StatesUpper middle incomeUruguayUzbekistanVanuatuVenezuela, RBVietnamWest Bank and GazaWorldZambiaZimbabwe Timeline:
This timeline shows a graph from 1966 to 2016 of Sierra Leone. No data until 1965. Number of actual observations by date: 51.
Source name:
World Development Indicators
Source organization:
World Bank national accounts data, and OECD National Accounts data files.
Categories, topics:
Economy & Growth
Last updated:
apr 23, 2017
Indicators value changes by year
Minimum:
-38.189
jan 1, 1991
At the date of observation
Value
Absolute change
Change from previous value
jan 1, 1966
14.694
+14.694
0.0%
jan 1, 1967
1.767
-12.926
-87.97%
jan 1, 1968
0.166
-1.601
-90.58%
jan 1, 1969
2.385
+2.218
1.33K%
jan 1, 1970
9.04
+6.655
279.06%
jan 1, 1971
9.697
+0.657
7.27%
jan 1, 1972
4.841
-4.856
-50.08%
jan 1, 1973
2.353
-2.488
-51.39%
jan 1, 1974
3.937
+1.584
67.33%
jan 1, 1975
4.528
+0.591
15.01%
jan 1, 1976
2.146
-2.382
-52.6%
jan 1, 1977
0.722
-1.425
-66.38%
jan 1, 1978
-0.378
-1.099
-152.35%
jan 1, 1979
-1.777
-1.4
370.5%
jan 1, 1980
1.608
+3.385
-190.46%
jan 1, 1981
6.438
+4.83
300.43%
jan 1, 1982
9.257
+2.819
43.79%
jan 1, 1983
5.953
-3.304
-35.69%
jan 1, 1984
-1.553
-7.506
-126.09%
jan 1, 1985
4.524
+6.078
-391.3%
jan 1, 1986
-16.478
-21.003
-464.21%
jan 1, 1987
-3.129
+13.35
-81.01%
jan 1, 1988
0.79
+3.919
-125.25%
jan 1, 1989
2.671
+1.881
238.09%
jan 1, 1990
5.157
+2.486
93.06%
jan 1, 1991
-38.189
-43.345
-840.52%
jan 1, 1992
-1.56
+36.629
-95.92%
jan 1, 1993
-26.8
-25.241
1.62K%
jan 1, 1994
9.439
+36.24
-135.22%
jan 1, 1995
-10.53
-19.969
-211.56%
jan 1, 1996
-2.863
+7.667
-72.81%
jan 1, 1997
5.485
+8.348
-291.56%
jan 1, 1998
-21.147
-26.631
-485.57%
jan 1, 1999
-1.671
+19.476
-92.1%
jan 1, 2000
-7.322
-5.651
338.19%
jan 1, 2001
3.95
+11.272
-153.95%
jan 1, 2002
66.12
+62.17
1.57K%
jan 1, 2003
19.002
-47.118
-71.26%
jan 1, 2004
5.46
-13.542
-71.27%
jan 1, 2005
1.924
-3.536
-64.76%
jan 1, 2006
1.913
-0.011
-0.59%
jan 1, 2007
5.342
+3.43
179.28%
jan 1, 2008
2.2
-3.143
-58.83%
jan 1, 2009
7.918
+5.718
259.94%
jan 1, 2010
8.352
+0.434
5.48%
jan 1, 2011
6.684
-1.668
-19.97%
jan 1, 2012
3.474
-3.21
-48.03%
jan 1, 2013
6.108
+2.634
75.83%
jan 1, 2014
6.297
+0.19
3.11%
jan 1, 2015
1.746
-4.551
-72.27%
jan 1, 2016
1.571
-0.175
-10.01%
Ranking of countries by current statistics by years


Comments: