29
/
en
AIzaSyAYiBZKx7MnpbEhh9jyipgxe19OcubqV5w
April 1, 2024
286590
Zambia
ZMB
true
2
1
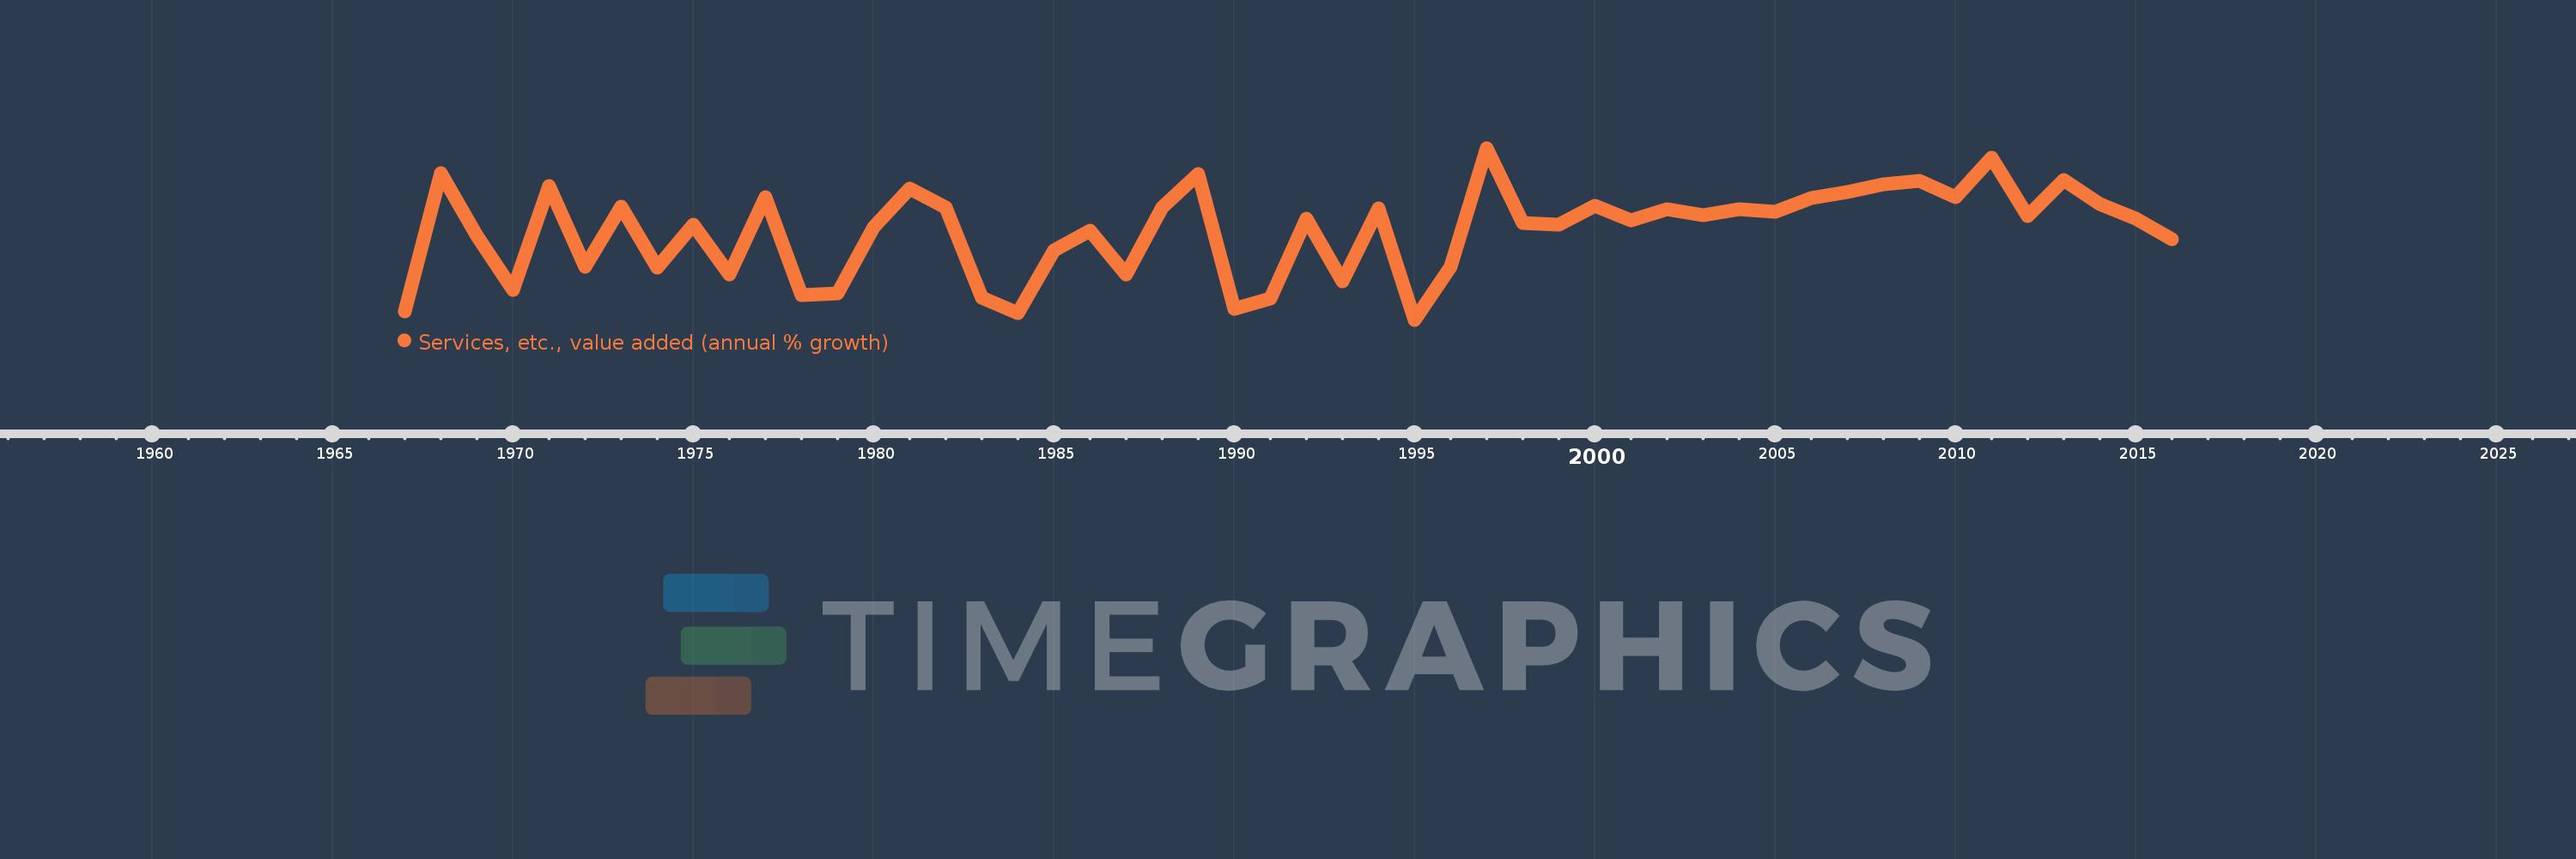
Services, etc., value added (annual % growth)
2016,2015,2014,2013,2012,2011,2010,2009,2008,2007,2006,2005,2004,2003,2002,2001,2000,1999,1998,1997,1996,1995,1994,1993,1992,1991,1990,1989,1988,1987,1986,1985,1984,1983,1982,1981,1980,1979,1978,1977,1976,1975,1974,1973,1972,1971,1970,1969,1968,1967
This statistics in other country:
AfghanistanAlbaniaAlgeriaAntigua and BarbudaArab WorldArgentinaArmeniaAustraliaAustriaAzerbaijanBahamas, TheBahrainBangladeshBelarusBelgiumBelizeBeninBermudaBhutanBoliviaBosnia and HerzegovinaBotswanaBrazilBrunei DarussalamBulgariaBurkina FasoBurundiCabo VerdeCambodiaCameroonCanadaCaribbean small statesCentral African RepublicCentral Europe and the BalticsChadChileChinaColombiaComorosCongo, Dem. Rep.Congo, Rep.Costa RicaCote d'IvoireCroatiaCubaCyprusCzech RepublicDenmarkDjiboutiDominicaDominican RepublicEarly-demographic dividendEast Asia & PacificEast Asia & Pacific (excluding high income)East Asia & Pacific (IDA & IBRD countries)EcuadorEgypt, Arab Rep.El SalvadorEquatorial GuineaEritreaEstoniaEthiopiaEuro areaEurope & Central AsiaEurope & Central Asia (excluding high income)Europe & Central Asia (IDA & IBRD countries)European UnionFijiFinlandFragile and conflict affected situationsFranceGabonGambia, TheGeorgiaGermanyGhanaGreeceGrenadaGuatemalaGuineaGuinea-BissauGuyanaHaitiHeavily indebted poor countries (HIPC)High incomeHondurasHong Kong SAR, ChinaHungaryIBRD onlyIcelandIDA & IBRD totalIDA blendIDA onlyIDA totalIndiaIndonesiaIran, Islamic Rep.IraqIrelandItalyJamaicaJapanJordanKazakhstanKenyaKiribatiKorea, Rep.KosovoKuwaitKyrgyz RepublicLao PDRLate-demographic dividendLatin America & Caribbean Latin America & Caribbean (excluding high income)Latin America & the Caribbean (IDA & IBRD countries)LatviaLeast developed countries: UN classificationLebanonLesothoLiberiaLithuaniaLow & middle incomeLow incomeLower middle incomeLuxembourgMacedonia, FYRMadagascarMalawiMalaysiaMaldivesMaliMarshall IslandsMauritaniaMauritiusMexicoMicronesia, Fed. Sts.Middle East & North AfricaMiddle East & North Africa (excluding high income)Middle East & North Africa (IDA & IBRD countries)Middle incomeMoldovaMongoliaMontenegroMoroccoMozambiqueMyanmarNamibiaNepalNetherlandsNew ZealandNicaraguaNigerNigeriaNorth AmericaNorwayOECD membersOmanOther small statesPacific island small statesPakistanPalauPanamaPapua New GuineaParaguayPeruPhilippinesPolandPortugalPost-demographic dividendPre-demographic dividendPuerto RicoQatarRomaniaRussian FederationRwandaSamoaSao Tome and PrincipeSaudi ArabiaSenegalSerbiaSeychellesSierra LeoneSingaporeSlovak RepublicSloveniaSmall statesSolomon IslandsSomaliaSouth AfricaSouth AsiaSouth Asia (IDA & IBRD)SpainSri LankaSt. Kitts and NevisSt. LuciaSt. Vincent and the GrenadinesSub-Saharan Africa Sub-Saharan Africa (excluding high income)Sub-Saharan Africa (IDA & IBRD countries)SudanSurinameSwazilandSwedenSwitzerlandSyrian Arab RepublicTajikistanTanzaniaThailandTimor-LesteTogoTongaTrinidad and TobagoTunisiaTurkeyTurkmenistanTuvaluUgandaUkraineUnited Arab EmiratesUnited KingdomUnited StatesUpper middle incomeUruguayUzbekistanVanuatuVenezuela, RBVietnamWest Bank and GazaWorldZambiaZimbabwe Timeline:
This timeline shows a graph from 1967 to 2016 of Zambia. No data until 1966. Number of actual observations by date: 50.
Source name:
World Development Indicators
Source organization:
World Bank national accounts data, and OECD National Accounts data files.
Categories, topics:
Economy & Growth
Last updated:
apr 23, 2017
Indicators value changes by year
Minimum:
-10.652
jan 1, 1995
Maximum:
16.908
jan 1, 1997
At the date of observation
Value
Absolute change
Change from previous value
jan 1, 1967
-9.338
-9.338
0.0%
jan 1, 1968
12.931
+22.269
-238.48%
jan 1, 1969
2.775
-10.156
-78.54%
jan 1, 1970
-5.921
-8.696
-313.36%
jan 1, 1971
10.739
+16.66
-281.37%
jan 1, 1972
-2.216
-12.955
-120.64%
jan 1, 1973
7.505
+9.722
-438.62%
jan 1, 1974
-2.331
-9.836
-131.05%
jan 1, 1975
4.661
+6.992
-299.99%
jan 1, 1976
-3.453
-8.115
-174.09%
jan 1, 1977
9.013
+12.467
-361.0%
jan 1, 1978
-6.724
-15.738
-174.61%
jan 1, 1979
-6.388
+0.336
-5.0%
jan 1, 1980
4.196
+10.584
-165.68%
jan 1, 1981
10.326
+6.13
146.09%
jan 1, 1982
7.317
-3.01
-29.14%
jan 1, 1983
-7.067
-14.383
-196.59%
jan 1, 1984
-9.624
-2.557
36.18%
jan 1, 1985
0.504
+10.127
-105.24%
jan 1, 1986
3.58
+3.076
610.41%
jan 1, 1987
-3.418
-6.998
-195.5%
jan 1, 1988
7.321
+10.74
-314.17%
jan 1, 1989
12.736
+5.415
73.97%
jan 1, 1990
-8.897
-21.634
-169.86%
jan 1, 1991
-7.24
+1.657
-18.62%
jan 1, 1992
5.544
+12.785
-176.58%
jan 1, 1993
-4.492
-10.036
-181.02%
jan 1, 1994
7.25
+11.742
-261.4%
jan 1, 1995
-10.652
-17.902
-246.93%
jan 1, 1996
-2.191
+8.461
-79.43%
jan 1, 1997
16.908
+19.098
-871.8%
jan 1, 1998
4.933
-11.975
-70.82%
jan 1, 1999
4.59
-0.343
-6.95%
jan 1, 2000
7.7
+3.109
67.74%
jan 1, 2001
5.276
-2.423
-31.47%
jan 1, 2002
7.021
+1.745
33.07%
jan 1, 2003
6.061
-0.961
-13.68%
jan 1, 2004
7.033
+0.972
16.04%
jan 1, 2005
6.704
-0.329
-4.68%
jan 1, 2006
8.834
+2.13
31.77%
jan 1, 2007
9.866
+1.032
11.68%
jan 1, 2008
11.114
+1.249
12.66%
jan 1, 2009
11.675
+0.56
5.04%
jan 1, 2010
9.026
-2.649
-22.69%
jan 1, 2011
15.387
+6.362
70.48%
jan 1, 2012
5.987
-9.4
-61.09%
jan 1, 2013
11.714
+5.726
95.64%
jan 1, 2014
7.894
-3.819
-32.61%
jan 1, 2015
5.621
-2.273
-28.8%
jan 1, 2016
2.204
-3.417
-60.8%
Ranking of countries by current statistics by years


Comments: