29
/
en
AIzaSyAYiBZKx7MnpbEhh9jyipgxe19OcubqV5w
April 1, 2024
87957
Bolivia
BOL
true
2
1
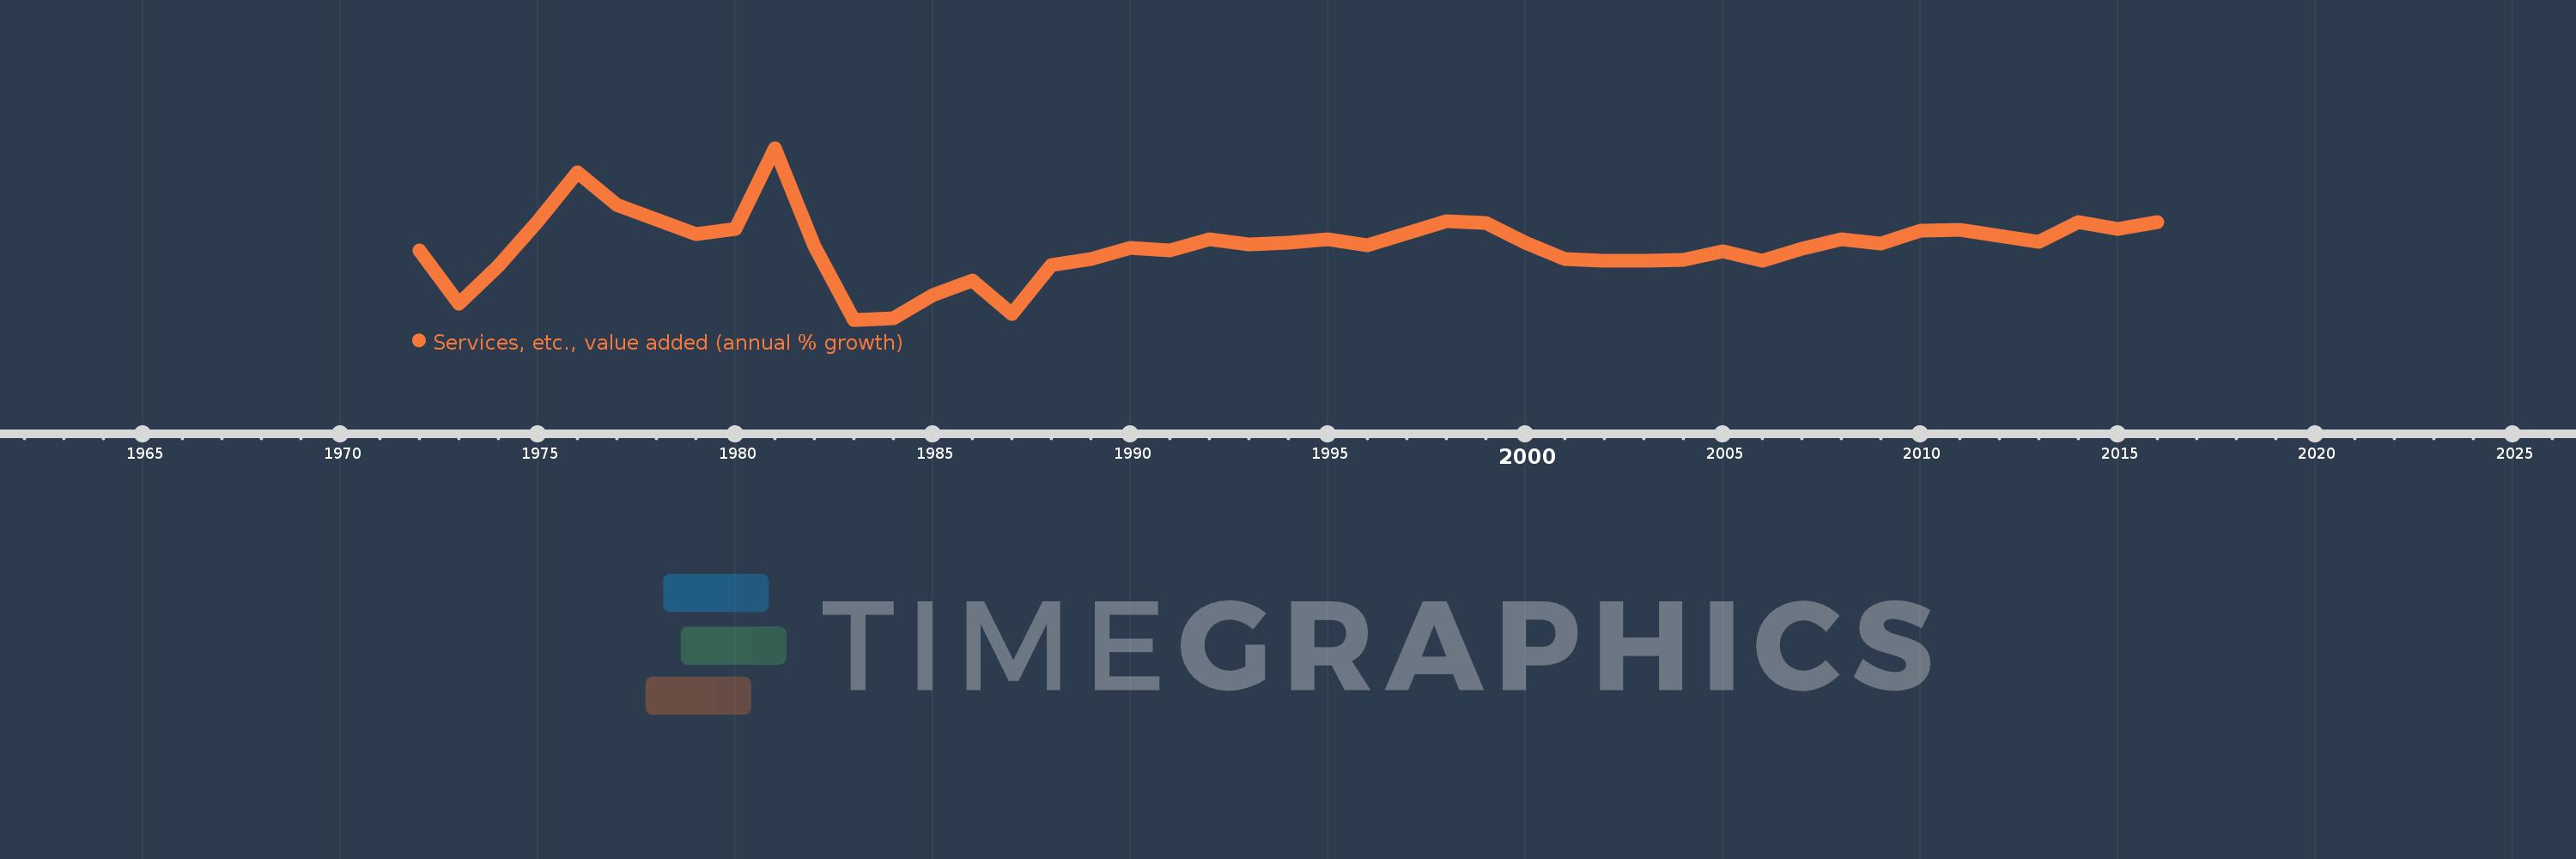
Services, etc., value added (annual % growth)
2016,2015,2014,2013,2012,2011,2010,2009,2008,2007,2006,2005,2004,2003,2002,2001,2000,1999,1998,1997,1996,1995,1994,1993,1992,1991,1990,1989,1988,1987,1986,1985,1984,1983,1982,1981,1980,1979,1978,1977,1976,1975,1974,1973,1972
This statistics in other country:
AfghanistanAlbaniaAlgeriaAntigua and BarbudaArab WorldArgentinaArmeniaAustraliaAustriaAzerbaijanBahamas, TheBahrainBangladeshBelarusBelgiumBelizeBeninBermudaBhutanBoliviaBosnia and HerzegovinaBotswanaBrazilBrunei DarussalamBulgariaBurkina FasoBurundiCabo VerdeCambodiaCameroonCanadaCaribbean small statesCentral African RepublicCentral Europe and the BalticsChadChileChinaColombiaComorosCongo, Dem. Rep.Congo, Rep.Costa RicaCote d'IvoireCroatiaCubaCyprusCzech RepublicDenmarkDjiboutiDominicaDominican RepublicEarly-demographic dividendEast Asia & PacificEast Asia & Pacific (excluding high income)East Asia & Pacific (IDA & IBRD countries)EcuadorEgypt, Arab Rep.El SalvadorEquatorial GuineaEritreaEstoniaEthiopiaEuro areaEurope & Central AsiaEurope & Central Asia (excluding high income)Europe & Central Asia (IDA & IBRD countries)European UnionFijiFinlandFragile and conflict affected situationsFranceGabonGambia, TheGeorgiaGermanyGhanaGreeceGrenadaGuatemalaGuineaGuinea-BissauGuyanaHaitiHeavily indebted poor countries (HIPC)High incomeHondurasHong Kong SAR, ChinaHungaryIBRD onlyIcelandIDA & IBRD totalIDA blendIDA onlyIDA totalIndiaIndonesiaIran, Islamic Rep.IraqIrelandItalyJamaicaJapanJordanKazakhstanKenyaKiribatiKorea, Rep.KosovoKuwaitKyrgyz RepublicLao PDRLate-demographic dividendLatin America & Caribbean Latin America & Caribbean (excluding high income)Latin America & the Caribbean (IDA & IBRD countries)LatviaLeast developed countries: UN classificationLebanonLesothoLiberiaLithuaniaLow & middle incomeLow incomeLower middle incomeLuxembourgMacedonia, FYRMadagascarMalawiMalaysiaMaldivesMaliMarshall IslandsMauritaniaMauritiusMexicoMicronesia, Fed. Sts.Middle East & North AfricaMiddle East & North Africa (excluding high income)Middle East & North Africa (IDA & IBRD countries)Middle incomeMoldovaMongoliaMontenegroMoroccoMozambiqueMyanmarNamibiaNepalNetherlandsNew ZealandNicaraguaNigerNigeriaNorth AmericaNorwayOECD membersOmanOther small statesPacific island small statesPakistanPalauPanamaPapua New GuineaParaguayPeruPhilippinesPolandPortugalPost-demographic dividendPre-demographic dividendPuerto RicoQatarRomaniaRussian FederationRwandaSamoaSao Tome and PrincipeSaudi ArabiaSenegalSerbiaSeychellesSierra LeoneSingaporeSlovak RepublicSloveniaSmall statesSolomon IslandsSomaliaSouth AfricaSouth AsiaSouth Asia (IDA & IBRD)SpainSri LankaSt. Kitts and NevisSt. LuciaSt. Vincent and the GrenadinesSub-Saharan Africa Sub-Saharan Africa (excluding high income)Sub-Saharan Africa (IDA & IBRD countries)SudanSurinameSwazilandSwedenSwitzerlandSyrian Arab RepublicTajikistanTanzaniaThailandTimor-LesteTogoTongaTrinidad and TobagoTunisiaTurkeyTurkmenistanTuvaluUgandaUkraineUnited Arab EmiratesUnited KingdomUnited StatesUpper middle incomeUruguayUzbekistanVanuatuVenezuela, RBVietnamWest Bank and GazaWorldZambiaZimbabwe Timeline:
This timeline shows a graph from 1972 to 2016 of Bolivia. No data until 1971. Number of actual observations by date: 45.
Source name:
World Development Indicators
Source organization:
World Bank national accounts data, and OECD National Accounts data files.
Categories, topics:
Economy & Growth
Last updated:
apr 23, 2017
Indicators value changes by year
Minimum:
-3.936
jan 1, 1983
Maximum:
13.168
jan 1, 1981
At the date of observation
Value
Absolute change
Change from previous value
jan 1, 1972
2.979
+2.979
0.0%
jan 1, 1973
-2.358
-5.337
-179.15%
jan 1, 1974
1.456
+3.814
-161.74%
jan 1, 1975
5.882
+4.426
303.99%
jan 1, 1976
10.765
+4.884
83.03%
jan 1, 1977
7.505
-3.26
-30.29%
jan 1, 1978
6.081
-1.424
-18.98%
jan 1, 1979
4.552
-1.529
-25.14%
jan 1, 1980
5.071
+0.519
11.41%
jan 1, 1981
13.168
+8.097
159.67%
jan 1, 1982
3.371
-9.798
-74.4%
jan 1, 1983
-3.936
-7.306
-216.77%
jan 1, 1984
-3.779
+0.157
-3.98%
jan 1, 1985
-1.483
+2.296
-60.76%
jan 1, 1986
-0.026
+1.457
-98.27%
jan 1, 1987
-3.351
-3.325
12.99K%
jan 1, 1988
1.527
+4.878
-145.58%
jan 1, 1989
2.079
+0.552
36.11%
jan 1, 1990
3.206
+1.127
54.2%
jan 1, 1991
2.934
-0.272
-8.48%
jan 1, 1992
4.106
+1.172
39.94%
jan 1, 1993
3.585
-0.52
-12.67%
jan 1, 1994
3.735
+0.15
4.18%
jan 1, 1995
4.077
+0.342
9.16%
jan 1, 1996
3.477
-0.6
-14.73%
jan 1, 1997
4.717
+1.24
35.66%
jan 1, 1998
5.839
+1.122
23.79%
jan 1, 1999
5.676
-0.163
-2.79%
jan 1, 2000
3.733
-1.943
-34.23%
jan 1, 2001
2.106
-1.627
-43.59%
jan 1, 2002
1.976
-0.13
-6.16%
jan 1, 2003
1.922
-0.054
-2.73%
jan 1, 2004
2.063
+0.141
7.35%
jan 1, 2005
2.914
+0.851
41.25%
jan 1, 2006
1.956
-0.959
-32.89%
jan 1, 2007
3.164
+1.208
61.78%
jan 1, 2008
4.039
+0.876
27.67%
jan 1, 2009
3.661
-0.378
-9.35%
jan 1, 2010
4.893
+1.232
33.64%
jan 1, 2011
5.017
+0.124
2.54%
jan 1, 2012
4.442
-0.575
-11.47%
jan 1, 2013
3.802
-0.64
-14.41%
jan 1, 2014
5.79
+1.988
52.3%
jan 1, 2015
5.131
-0.659
-11.39%
jan 1, 2016
5.804
+0.674
13.13%
Ranking of countries by current statistics by years


Comments: