29
/
en
AIzaSyAYiBZKx7MnpbEhh9jyipgxe19OcubqV5w
April 1, 2024
260263
Tajikistan
TJK
true
2
1
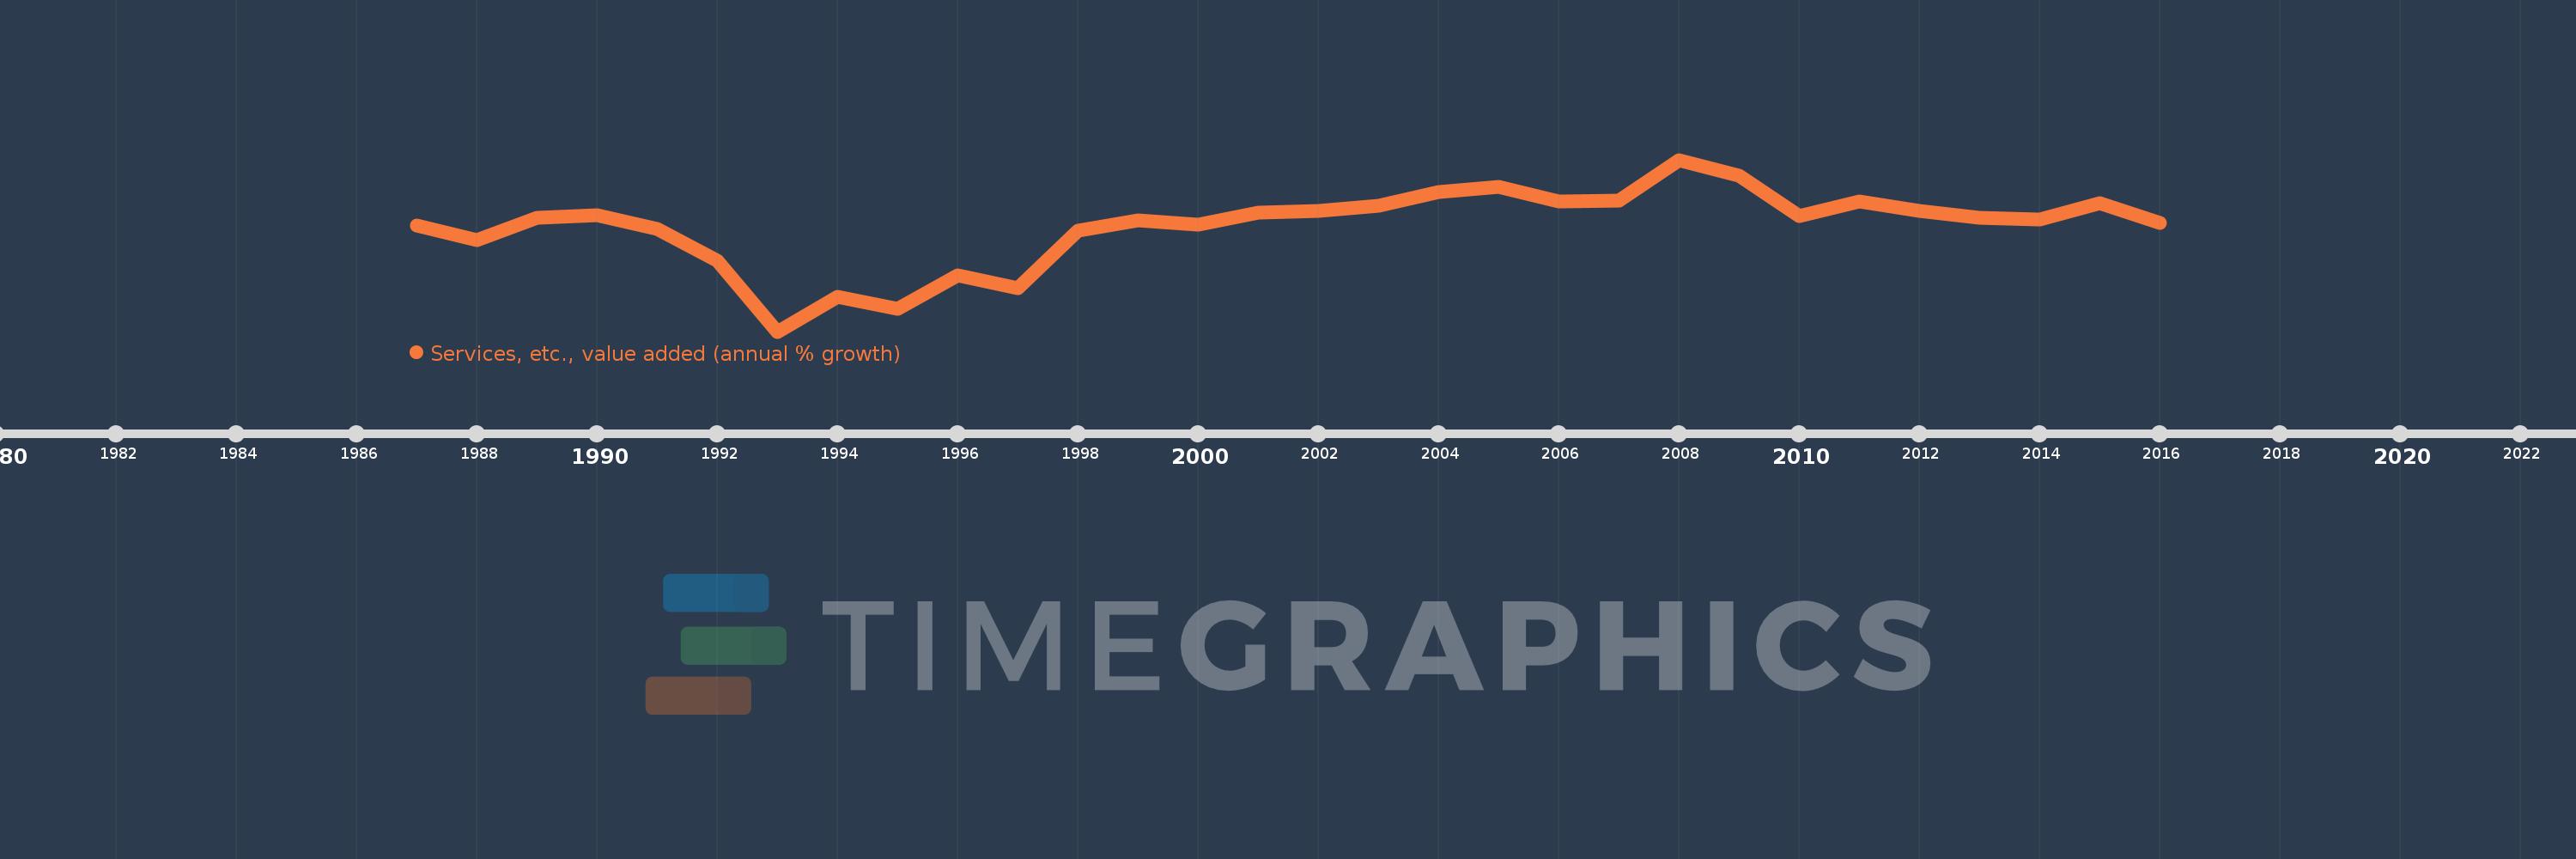
Services, etc., value added (annual % growth)
2016,2015,2014,2013,2012,2011,2010,2009,2008,2007,2006,2005,2004,2003,2002,2001,2000,1999,1998,1997,1996,1995,1994,1993,1992,1991,1990,1989,1988,1987
This statistics in other country:
AfghanistanAlbaniaAlgeriaAntigua and BarbudaArab WorldArgentinaArmeniaAustraliaAustriaAzerbaijanBahamas, TheBahrainBangladeshBelarusBelgiumBelizeBeninBermudaBhutanBoliviaBosnia and HerzegovinaBotswanaBrazilBrunei DarussalamBulgariaBurkina FasoBurundiCabo VerdeCambodiaCameroonCanadaCaribbean small statesCentral African RepublicCentral Europe and the BalticsChadChileChinaColombiaComorosCongo, Dem. Rep.Congo, Rep.Costa RicaCote d'IvoireCroatiaCubaCyprusCzech RepublicDenmarkDjiboutiDominicaDominican RepublicEarly-demographic dividendEast Asia & PacificEast Asia & Pacific (excluding high income)East Asia & Pacific (IDA & IBRD countries)EcuadorEgypt, Arab Rep.El SalvadorEquatorial GuineaEritreaEstoniaEthiopiaEuro areaEurope & Central AsiaEurope & Central Asia (excluding high income)Europe & Central Asia (IDA & IBRD countries)European UnionFijiFinlandFragile and conflict affected situationsFranceGabonGambia, TheGeorgiaGermanyGhanaGreeceGrenadaGuatemalaGuineaGuinea-BissauGuyanaHaitiHeavily indebted poor countries (HIPC)High incomeHondurasHong Kong SAR, ChinaHungaryIBRD onlyIcelandIDA & IBRD totalIDA blendIDA onlyIDA totalIndiaIndonesiaIran, Islamic Rep.IraqIrelandItalyJamaicaJapanJordanKazakhstanKenyaKiribatiKorea, Rep.KosovoKuwaitKyrgyz RepublicLao PDRLate-demographic dividendLatin America & Caribbean Latin America & Caribbean (excluding high income)Latin America & the Caribbean (IDA & IBRD countries)LatviaLeast developed countries: UN classificationLebanonLesothoLiberiaLithuaniaLow & middle incomeLow incomeLower middle incomeLuxembourgMacedonia, FYRMadagascarMalawiMalaysiaMaldivesMaliMarshall IslandsMauritaniaMauritiusMexicoMicronesia, Fed. Sts.Middle East & North AfricaMiddle East & North Africa (excluding high income)Middle East & North Africa (IDA & IBRD countries)Middle incomeMoldovaMongoliaMontenegroMoroccoMozambiqueMyanmarNamibiaNepalNetherlandsNew ZealandNicaraguaNigerNigeriaNorth AmericaNorwayOECD membersOmanOther small statesPacific island small statesPakistanPalauPanamaPapua New GuineaParaguayPeruPhilippinesPolandPortugalPost-demographic dividendPre-demographic dividendPuerto RicoQatarRomaniaRussian FederationRwandaSamoaSao Tome and PrincipeSaudi ArabiaSenegalSerbiaSeychellesSierra LeoneSingaporeSlovak RepublicSloveniaSmall statesSolomon IslandsSomaliaSouth AfricaSouth AsiaSouth Asia (IDA & IBRD)SpainSri LankaSt. Kitts and NevisSt. LuciaSt. Vincent and the GrenadinesSub-Saharan Africa Sub-Saharan Africa (excluding high income)Sub-Saharan Africa (IDA & IBRD countries)SudanSurinameSwazilandSwedenSwitzerlandSyrian Arab RepublicTajikistanTanzaniaThailandTimor-LesteTogoTongaTrinidad and TobagoTunisiaTurkeyTurkmenistanTuvaluUgandaUkraineUnited Arab EmiratesUnited KingdomUnited StatesUpper middle incomeUruguayUzbekistanVanuatuVenezuela, RBVietnamWest Bank and GazaWorldZambiaZimbabwe Timeline:
This timeline shows a graph from 1987 to 2016 of Tajikistan. No data until 1986. Number of actual observations by date: 30.
Source name:
World Development Indicators
Source organization:
World Bank national accounts data, and OECD National Accounts data files.
Categories, topics:
Economy & Growth
Last updated:
apr 23, 2017
Indicators value changes by year
Minimum:
-29.31
jan 1, 1993
Maximum:
23.576
jan 1, 2008
At the date of observation
Value
Absolute change
Change from previous value
jan 1, 1988
-1.2
-4.6
-135.29%
jan 1, 1989
5.8
+7.0
-583.33%
jan 1, 1990
6.4
+0.6
10.34%
jan 1, 1991
2.2
-4.2
-65.62%
jan 1, 1992
-7.371
-9.571
-435.05%
jan 1, 1993
-29.31
-21.939
297.63%
jan 1, 1994
-18.587
+10.723
-36.58%
jan 1, 1995
-22.358
-3.771
20.29%
jan 1, 1996
-12.086
+10.272
-45.95%
jan 1, 1997
-15.898
-3.812
31.54%
jan 1, 1998
1.851
+17.748
-111.64%
jan 1, 1999
4.913
+3.063
165.46%
jan 1, 2000
3.587
-1.327
-27.0%
jan 1, 2001
7.439
+3.852
107.39%
jan 1, 2002
7.937
+0.498
6.7%
jan 1, 2003
9.556
+1.619
20.39%
jan 1, 2004
13.552
+3.997
41.83%
jan 1, 2005
15.207
+1.654
12.21%
jan 1, 2006
10.877
-4.329
-28.47%
jan 1, 2007
10.926
+0.048
0.44%
jan 1, 2008
23.576
+12.65
115.78%
jan 1, 2009
18.748
-4.828
-20.48%
jan 1, 2010
6.269
-12.479
-66.56%
jan 1, 2011
10.703
+4.434
70.73%
jan 1, 2012
7.829
-2.874
-26.86%
jan 1, 2013
5.826
-2.002
-25.57%
jan 1, 2014
5.299
-0.528
-9.06%
jan 1, 2015
10.101
+4.802
90.63%
jan 1, 2016
4.182
-5.918
-58.59%
Ranking of countries by current statistics by years


Comments: