29
/
en
AIzaSyAYiBZKx7MnpbEhh9jyipgxe19OcubqV5w
April 1, 2024
37004
IBRD only
IBD
false
2
1
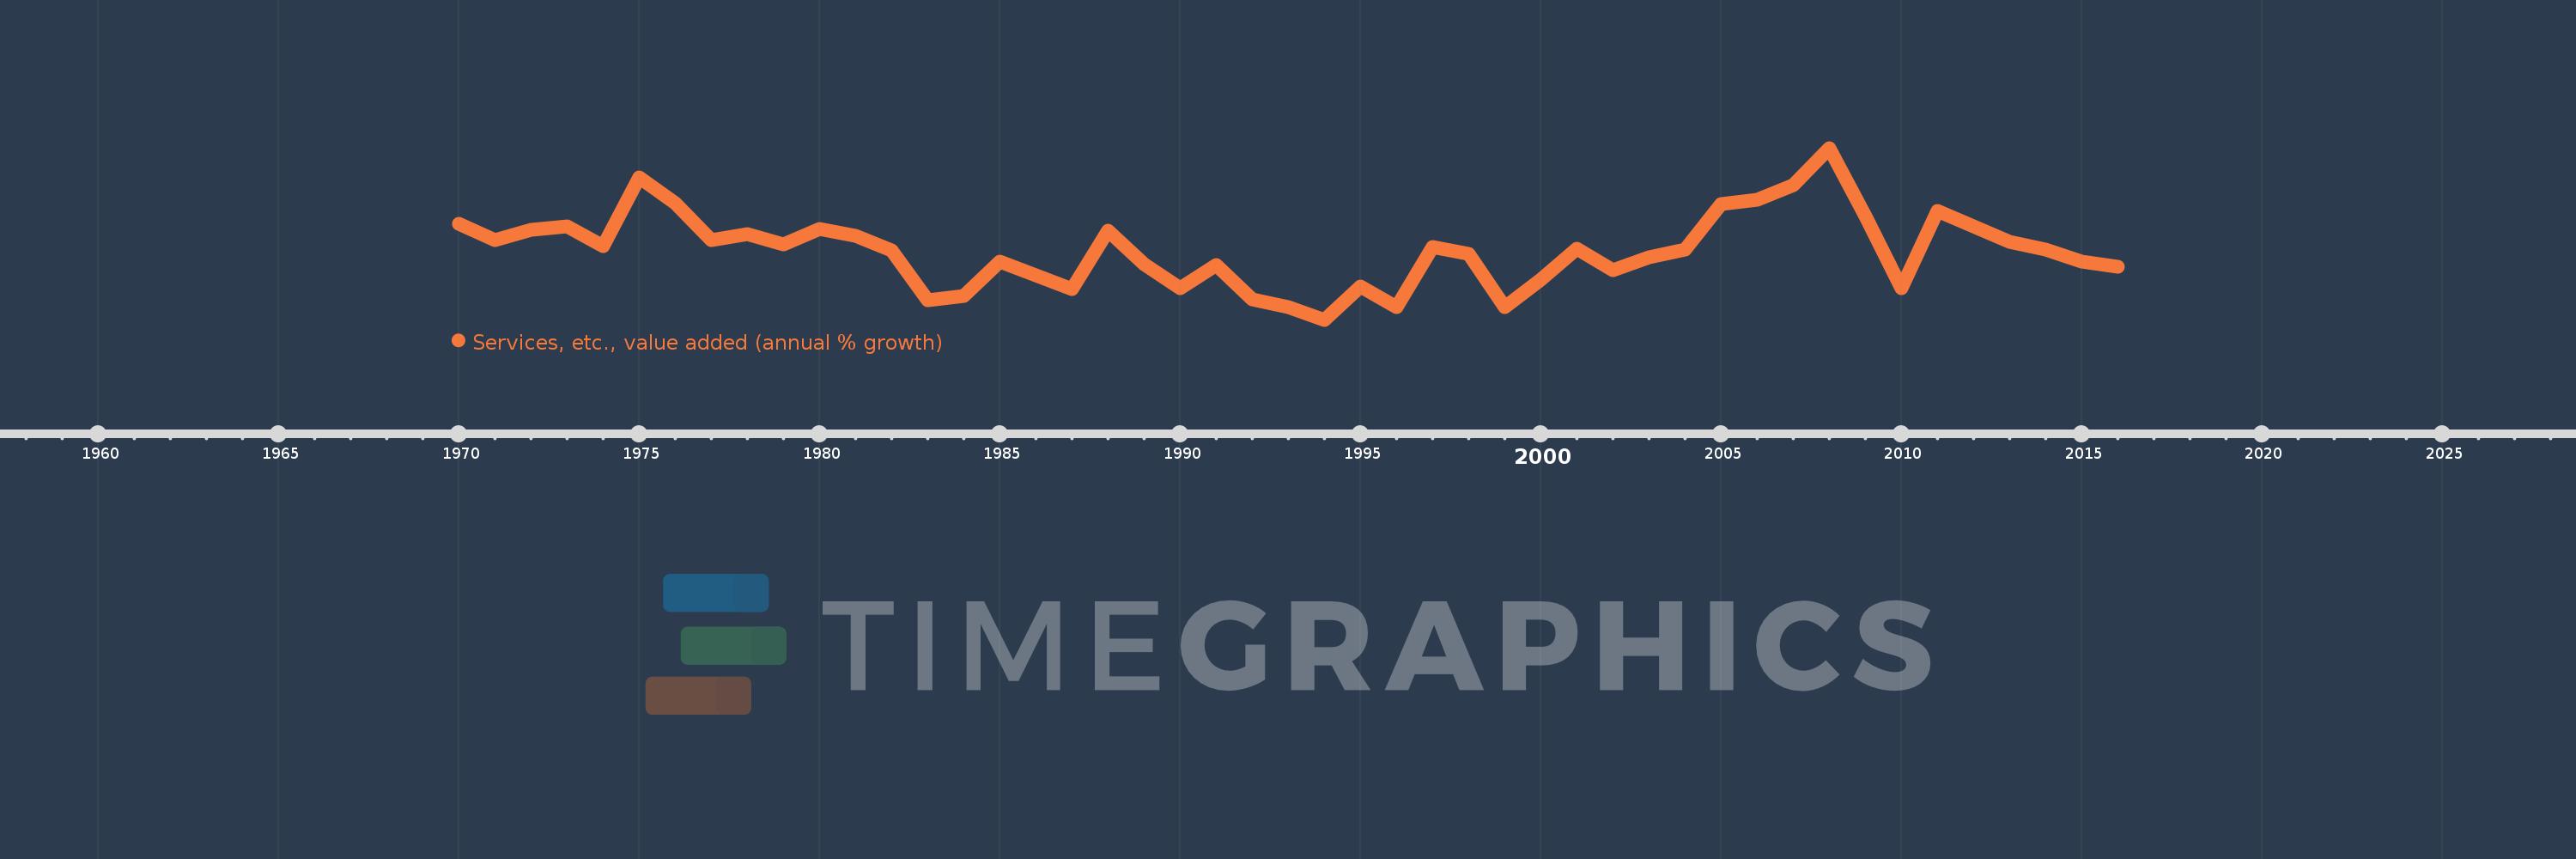
Services, etc., value added (annual % growth)
2016,2015,2014,2013,2012,2011,2010,2009,2008,2007,2006,2005,2004,2003,2002,2001,2000,1999,1998,1997,1996,1995,1994,1993,1992,1991,1990,1989,1988,1987,1986,1985,1984,1983,1982,1981,1980,1979,1978,1977,1976,1975,1974,1973,1972,1971,1970
This statistics in other country:
AfghanistanAlbaniaAlgeriaAntigua and BarbudaArab WorldArgentinaArmeniaAustraliaAustriaAzerbaijanBahamas, TheBahrainBangladeshBelarusBelgiumBelizeBeninBermudaBhutanBoliviaBosnia and HerzegovinaBotswanaBrazilBrunei DarussalamBulgariaBurkina FasoBurundiCabo VerdeCambodiaCameroonCanadaCaribbean small statesCentral African RepublicCentral Europe and the BalticsChadChileChinaColombiaComorosCongo, Dem. Rep.Congo, Rep.Costa RicaCote d'IvoireCroatiaCubaCyprusCzech RepublicDenmarkDjiboutiDominicaDominican RepublicEarly-demographic dividendEast Asia & PacificEast Asia & Pacific (excluding high income)East Asia & Pacific (IDA & IBRD countries)EcuadorEgypt, Arab Rep.El SalvadorEquatorial GuineaEritreaEstoniaEthiopiaEuro areaEurope & Central AsiaEurope & Central Asia (excluding high income)Europe & Central Asia (IDA & IBRD countries)European UnionFijiFinlandFragile and conflict affected situationsFranceGabonGambia, TheGeorgiaGermanyGhanaGreeceGrenadaGuatemalaGuineaGuinea-BissauGuyanaHaitiHeavily indebted poor countries (HIPC)High incomeHondurasHong Kong SAR, ChinaHungaryIBRD onlyIcelandIDA & IBRD totalIDA blendIDA onlyIDA totalIndiaIndonesiaIran, Islamic Rep.IraqIrelandItalyJamaicaJapanJordanKazakhstanKenyaKiribatiKorea, Rep.KosovoKuwaitKyrgyz RepublicLao PDRLate-demographic dividendLatin America & Caribbean Latin America & Caribbean (excluding high income)Latin America & the Caribbean (IDA & IBRD countries)LatviaLeast developed countries: UN classificationLebanonLesothoLiberiaLithuaniaLow & middle incomeLow incomeLower middle incomeLuxembourgMacedonia, FYRMadagascarMalawiMalaysiaMaldivesMaliMarshall IslandsMauritaniaMauritiusMexicoMicronesia, Fed. Sts.Middle East & North AfricaMiddle East & North Africa (excluding high income)Middle East & North Africa (IDA & IBRD countries)Middle incomeMoldovaMongoliaMontenegroMoroccoMozambiqueMyanmarNamibiaNepalNetherlandsNew ZealandNicaraguaNigerNigeriaNorth AmericaNorwayOECD membersOmanOther small statesPacific island small statesPakistanPalauPanamaPapua New GuineaParaguayPeruPhilippinesPolandPortugalPost-demographic dividendPre-demographic dividendPuerto RicoQatarRomaniaRussian FederationRwandaSamoaSao Tome and PrincipeSaudi ArabiaSenegalSerbiaSeychellesSierra LeoneSingaporeSlovak RepublicSloveniaSmall statesSolomon IslandsSomaliaSouth AfricaSouth AsiaSouth Asia (IDA & IBRD)SpainSri LankaSt. Kitts and NevisSt. LuciaSt. Vincent and the GrenadinesSub-Saharan Africa Sub-Saharan Africa (excluding high income)Sub-Saharan Africa (IDA & IBRD countries)SudanSurinameSwazilandSwedenSwitzerlandSyrian Arab RepublicTajikistanTanzaniaThailandTimor-LesteTogoTongaTrinidad and TobagoTunisiaTurkeyTurkmenistanTuvaluUgandaUkraineUnited Arab EmiratesUnited KingdomUnited StatesUpper middle incomeUruguayUzbekistanVanuatuVenezuela, RBVietnamWest Bank and GazaWorldZambiaZimbabwe Timeline:
This timeline shows a graph from 1970 to 2016 of IBRD only. No data until 1969. Number of actual observations by date: 47.
Source name:
World Development Indicators
Source organization:
World Bank national accounts data, and OECD National Accounts data files.
Categories, topics:
Economy & Growth
Last updated:
apr 23, 2017
Indicators value changes by year
Maximum:
10.123
jan 1, 2008
At the date of observation
Value
Absolute change
Change from previous value
jan 1, 1970
6.33
+6.33
0.0%
jan 1, 1971
5.549
-0.781
-12.33%
jan 1, 1972
6.032
+0.483
8.7%
jan 1, 1973
6.231
+0.199
3.29%
jan 1, 1974
5.243
-0.987
-15.85%
jan 1, 1975
8.652
+3.408
65.01%
jan 1, 1976
7.37
-1.282
-14.82%
jan 1, 1977
5.545
-1.825
-24.76%
jan 1, 1978
5.848
+0.303
5.47%
jan 1, 1979
5.31
-0.538
-9.21%
jan 1, 1980
6.078
+0.769
14.48%
jan 1, 1981
5.759
-0.319
-5.25%
jan 1, 1982
5.025
-0.734
-12.75%
jan 1, 1983
2.524
-2.501
-49.77%
jan 1, 1984
2.741
+0.217
8.58%
jan 1, 1985
4.478
+1.738
63.4%
jan 1, 1986
3.782
-0.697
-15.56%
jan 1, 1987
3.091
-0.691
-18.28%
jan 1, 1988
5.99
+2.899
93.81%
jan 1, 1989
4.313
-1.677
-27.99%
jan 1, 1990
3.146
-1.167
-27.06%
jan 1, 1991
4.271
+1.125
35.77%
jan 1, 1992
2.559
-1.712
-40.08%
jan 1, 1993
2.215
-0.345
-13.47%
jan 1, 1994
1.566
-0.649
-29.29%
jan 1, 1995
3.201
+1.635
104.4%
jan 1, 1996
2.2
-1.001
-31.28%
jan 1, 1997
5.172
+2.972
135.12%
jan 1, 1998
4.843
-0.329
-6.36%
jan 1, 1999
2.202
-2.641
-54.54%
jan 1, 2000
3.549
+1.348
61.22%
jan 1, 2001
5.115
+1.566
44.12%
jan 1, 2002
4.025
-1.09
-21.31%
jan 1, 2003
4.684
+0.659
16.38%
jan 1, 2004
5.062
+0.378
8.06%
jan 1, 2005
7.327
+2.265
44.75%
jan 1, 2006
7.564
+0.236
3.23%
jan 1, 2007
8.268
+0.704
9.31%
jan 1, 2008
10.123
+1.855
22.44%
jan 1, 2009
6.726
-3.398
-33.56%
jan 1, 2010
3.125
-3.601
-53.53%
jan 1, 2011
6.968
+3.843
122.96%
jan 1, 2012
6.212
-0.755
-10.84%
jan 1, 2013
5.452
-0.761
-12.24%
jan 1, 2014
5.048
-0.404
-7.41%
jan 1, 2015
4.483
-0.565
-11.19%
jan 1, 2016
4.187
-0.296
-6.6%
Ranking of countries by current statistics by years


Comments: