29
/
en
AIzaSyAYiBZKx7MnpbEhh9jyipgxe19OcubqV5w
April 1, 2024
163272
Jamaica
JAM
true
2
1
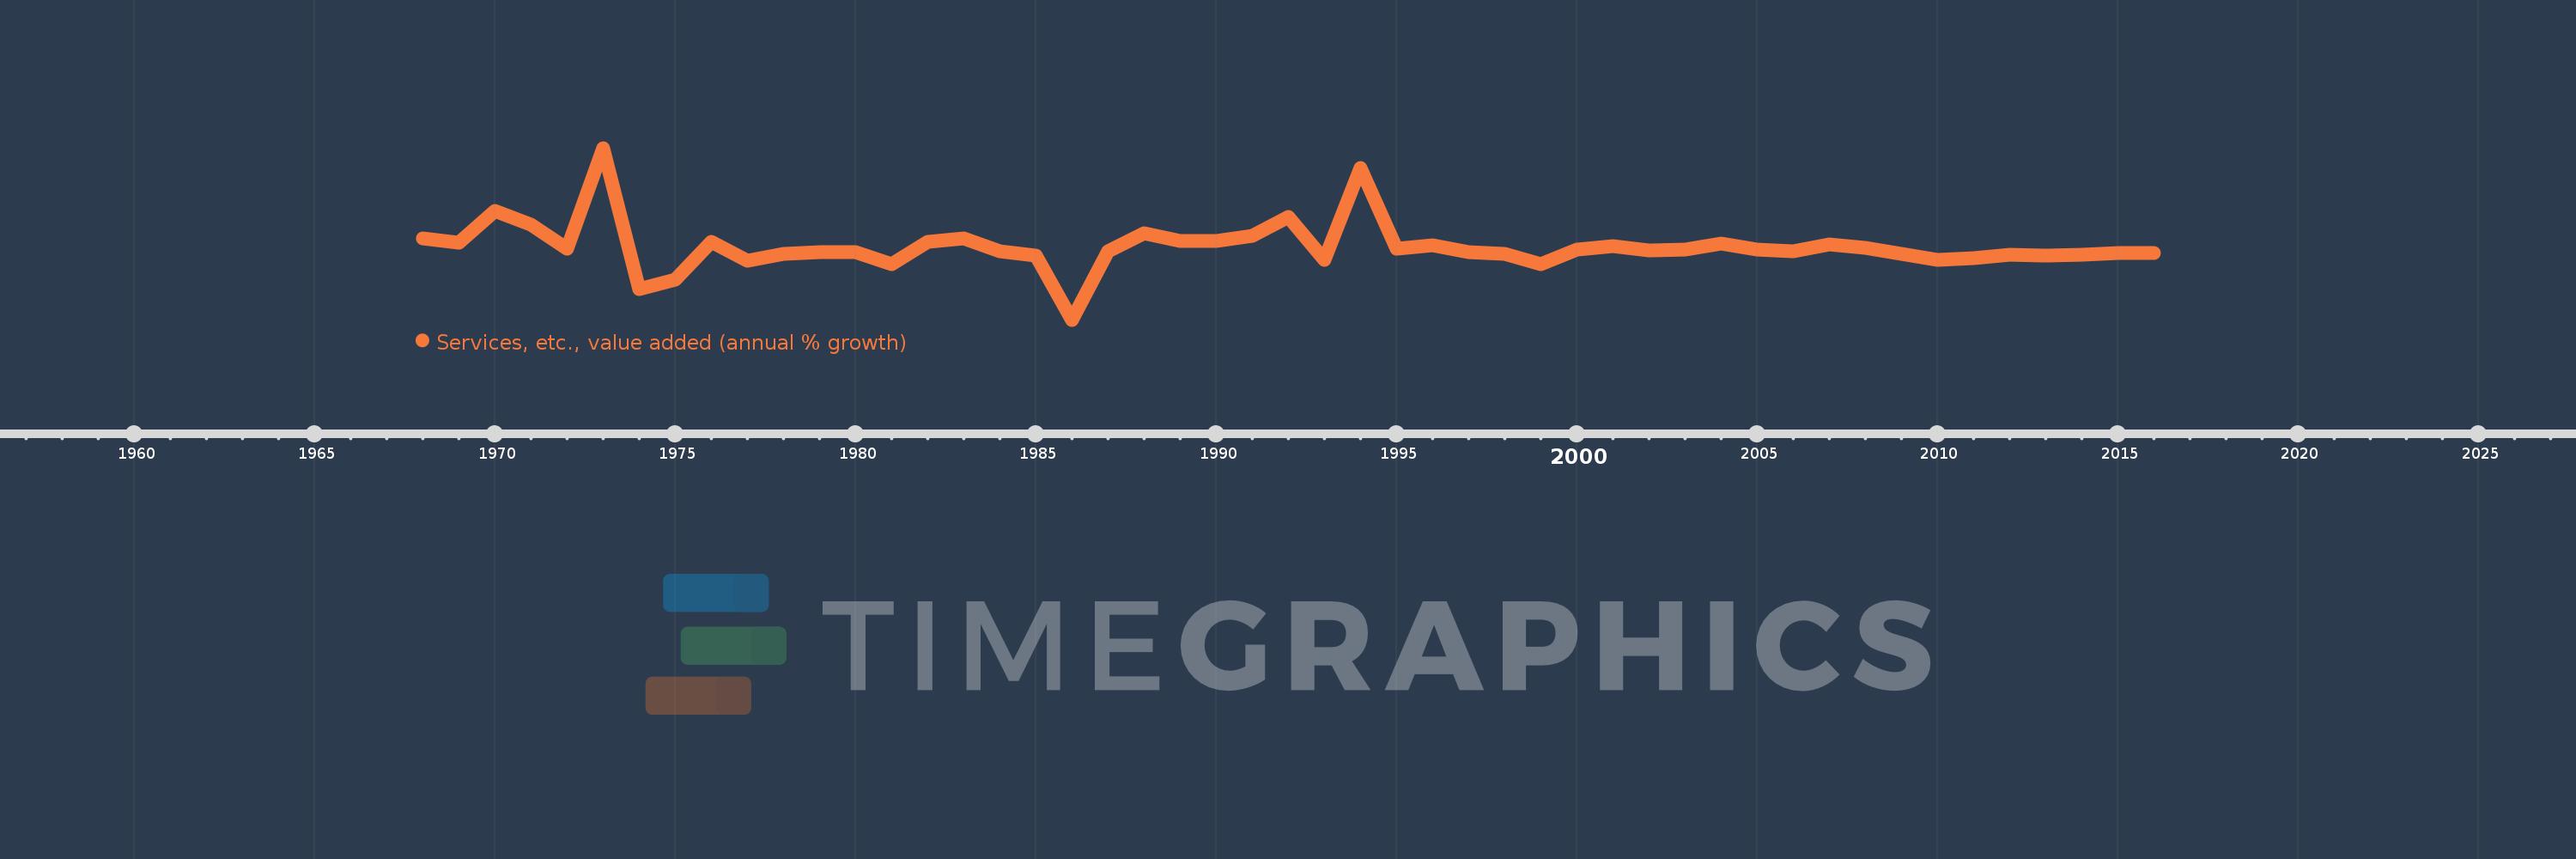
Services, etc., value added (annual % growth)
2016,2015,2014,2013,2012,2011,2010,2009,2008,2007,2006,2005,2004,2003,2002,2001,2000,1999,1998,1997,1996,1995,1994,1993,1992,1991,1990,1989,1988,1987,1986,1985,1984,1983,1982,1981,1980,1979,1978,1977,1976,1975,1974,1973,1972,1971,1970,1969,1968
This statistics in other country:
AfghanistanAlbaniaAlgeriaAntigua and BarbudaArab WorldArgentinaArmeniaAustraliaAustriaAzerbaijanBahamas, TheBahrainBangladeshBelarusBelgiumBelizeBeninBermudaBhutanBoliviaBosnia and HerzegovinaBotswanaBrazilBrunei DarussalamBulgariaBurkina FasoBurundiCabo VerdeCambodiaCameroonCanadaCaribbean small statesCentral African RepublicCentral Europe and the BalticsChadChileChinaColombiaComorosCongo, Dem. Rep.Congo, Rep.Costa RicaCote d'IvoireCroatiaCubaCyprusCzech RepublicDenmarkDjiboutiDominicaDominican RepublicEarly-demographic dividendEast Asia & PacificEast Asia & Pacific (excluding high income)East Asia & Pacific (IDA & IBRD countries)EcuadorEgypt, Arab Rep.El SalvadorEquatorial GuineaEritreaEstoniaEthiopiaEuro areaEurope & Central AsiaEurope & Central Asia (excluding high income)Europe & Central Asia (IDA & IBRD countries)European UnionFijiFinlandFragile and conflict affected situationsFranceGabonGambia, TheGeorgiaGermanyGhanaGreeceGrenadaGuatemalaGuineaGuinea-BissauGuyanaHaitiHeavily indebted poor countries (HIPC)High incomeHondurasHong Kong SAR, ChinaHungaryIBRD onlyIcelandIDA & IBRD totalIDA blendIDA onlyIDA totalIndiaIndonesiaIran, Islamic Rep.IraqIrelandItalyJamaicaJapanJordanKazakhstanKenyaKiribatiKorea, Rep.KosovoKuwaitKyrgyz RepublicLao PDRLate-demographic dividendLatin America & Caribbean Latin America & Caribbean (excluding high income)Latin America & the Caribbean (IDA & IBRD countries)LatviaLeast developed countries: UN classificationLebanonLesothoLiberiaLithuaniaLow & middle incomeLow incomeLower middle incomeLuxembourgMacedonia, FYRMadagascarMalawiMalaysiaMaldivesMaliMarshall IslandsMauritaniaMauritiusMexicoMicronesia, Fed. Sts.Middle East & North AfricaMiddle East & North Africa (excluding high income)Middle East & North Africa (IDA & IBRD countries)Middle incomeMoldovaMongoliaMontenegroMoroccoMozambiqueMyanmarNamibiaNepalNetherlandsNew ZealandNicaraguaNigerNigeriaNorth AmericaNorwayOECD membersOmanOther small statesPacific island small statesPakistanPalauPanamaPapua New GuineaParaguayPeruPhilippinesPolandPortugalPost-demographic dividendPre-demographic dividendPuerto RicoQatarRomaniaRussian FederationRwandaSamoaSao Tome and PrincipeSaudi ArabiaSenegalSerbiaSeychellesSierra LeoneSingaporeSlovak RepublicSloveniaSmall statesSolomon IslandsSomaliaSouth AfricaSouth AsiaSouth Asia (IDA & IBRD)SpainSri LankaSt. Kitts and NevisSt. LuciaSt. Vincent and the GrenadinesSub-Saharan Africa Sub-Saharan Africa (excluding high income)Sub-Saharan Africa (IDA & IBRD countries)SudanSurinameSwazilandSwedenSwitzerlandSyrian Arab RepublicTajikistanTanzaniaThailandTimor-LesteTogoTongaTrinidad and TobagoTunisiaTurkeyTurkmenistanTuvaluUgandaUkraineUnited Arab EmiratesUnited KingdomUnited StatesUpper middle incomeUruguayUzbekistanVanuatuVenezuela, RBVietnamWest Bank and GazaWorldZambiaZimbabwe Timeline:
This timeline shows a graph from 1968 to 2016 of Jamaica. No data until 1967. Number of actual observations by date: 49.
Source name:
World Development Indicators
Source organization:
World Bank national accounts data, and OECD National Accounts data files.
Categories, topics:
Economy & Growth
Last updated:
apr 23, 2017
Indicators value changes by year
Minimum:
-19.616
jan 1, 1986
Maximum:
32.567
jan 1, 1973
At the date of observation
Value
Absolute change
Change from previous value
jan 1, 1968
5.059
+5.059
0.0%
jan 1, 1969
3.782
-1.277
-25.24%
jan 1, 1970
13.556
+9.775
258.49%
jan 1, 1971
9.369
-4.188
-30.89%
jan 1, 1972
1.975
-7.394
-78.92%
jan 1, 1973
32.567
+30.592
1.55K%
jan 1, 1974
-10.202
-42.769
-131.33%
jan 1, 1975
-7.442
+2.76
-27.06%
jan 1, 1976
3.923
+11.365
-152.72%
jan 1, 1977
-1.729
-5.653
-144.08%
jan 1, 1978
0.513
+2.242
-129.63%
jan 1, 1979
0.807
+0.295
57.51%
jan 1, 1980
0.883
+0.076
9.44%
jan 1, 1981
-2.641
-3.524
-398.97%
jan 1, 1982
3.991
+6.632
-251.1%
jan 1, 1983
4.982
+0.991
24.83%
jan 1, 1984
1.152
-3.829
-76.87%
jan 1, 1985
-0.192
-1.344
-116.65%
jan 1, 1986
-19.616
-19.424
10.13K%
jan 1, 1987
1.308
+20.924
-106.67%
jan 1, 1988
6.582
+5.273
403.08%
jan 1, 1989
4.335
-2.247
-34.13%
jan 1, 1990
4.211
-0.124
-2.86%
jan 1, 1991
5.763
+1.552
36.85%
jan 1, 1992
11.512
+5.749
99.77%
jan 1, 1993
-1.315
-12.828
-111.43%
jan 1, 1994
26.491
+27.807
-2.11K%
jan 1, 1995
1.929
-24.562
-92.72%
jan 1, 1996
3.061
+1.132
58.69%
jan 1, 1997
1.034
-2.027
-66.23%
jan 1, 1998
0.409
-0.625
-60.45%
jan 1, 1999
-2.723
-3.131
-765.79%
jan 1, 2000
1.617
+4.34
-159.4%
jan 1, 2001
2.76
+1.143
70.67%
jan 1, 2002
1.324
-1.436
-52.04%
jan 1, 2003
1.82
+0.496
37.51%
jan 1, 2004
3.629
+1.808
99.35%
jan 1, 2005
1.68
-1.948
-53.69%
jan 1, 2006
1.206
-0.474
-28.22%
jan 1, 2007
3.213
+2.007
166.4%
jan 1, 2008
2.231
-0.983
-30.58%
jan 1, 2009
0.409
-1.821
-81.65%
jan 1, 2010
-1.401
-1.811
-442.31%
jan 1, 2011
-1.018
+0.384
-27.38%
jan 1, 2012
0.262
+1.28
-125.74%
jan 1, 2013
-0.05
-0.312
-119.08%
jan 1, 2014
0.231
+0.281
-561.22%
jan 1, 2015
0.73
+0.5
216.85%
jan 1, 2016
0.682
-0.049
-6.68%
Ranking of countries by current statistics by years


Comments: