29
/
en
AIzaSyAYiBZKx7MnpbEhh9jyipgxe19OcubqV5w
April 1, 2024
202294
Morocco
MAR
true
2
1
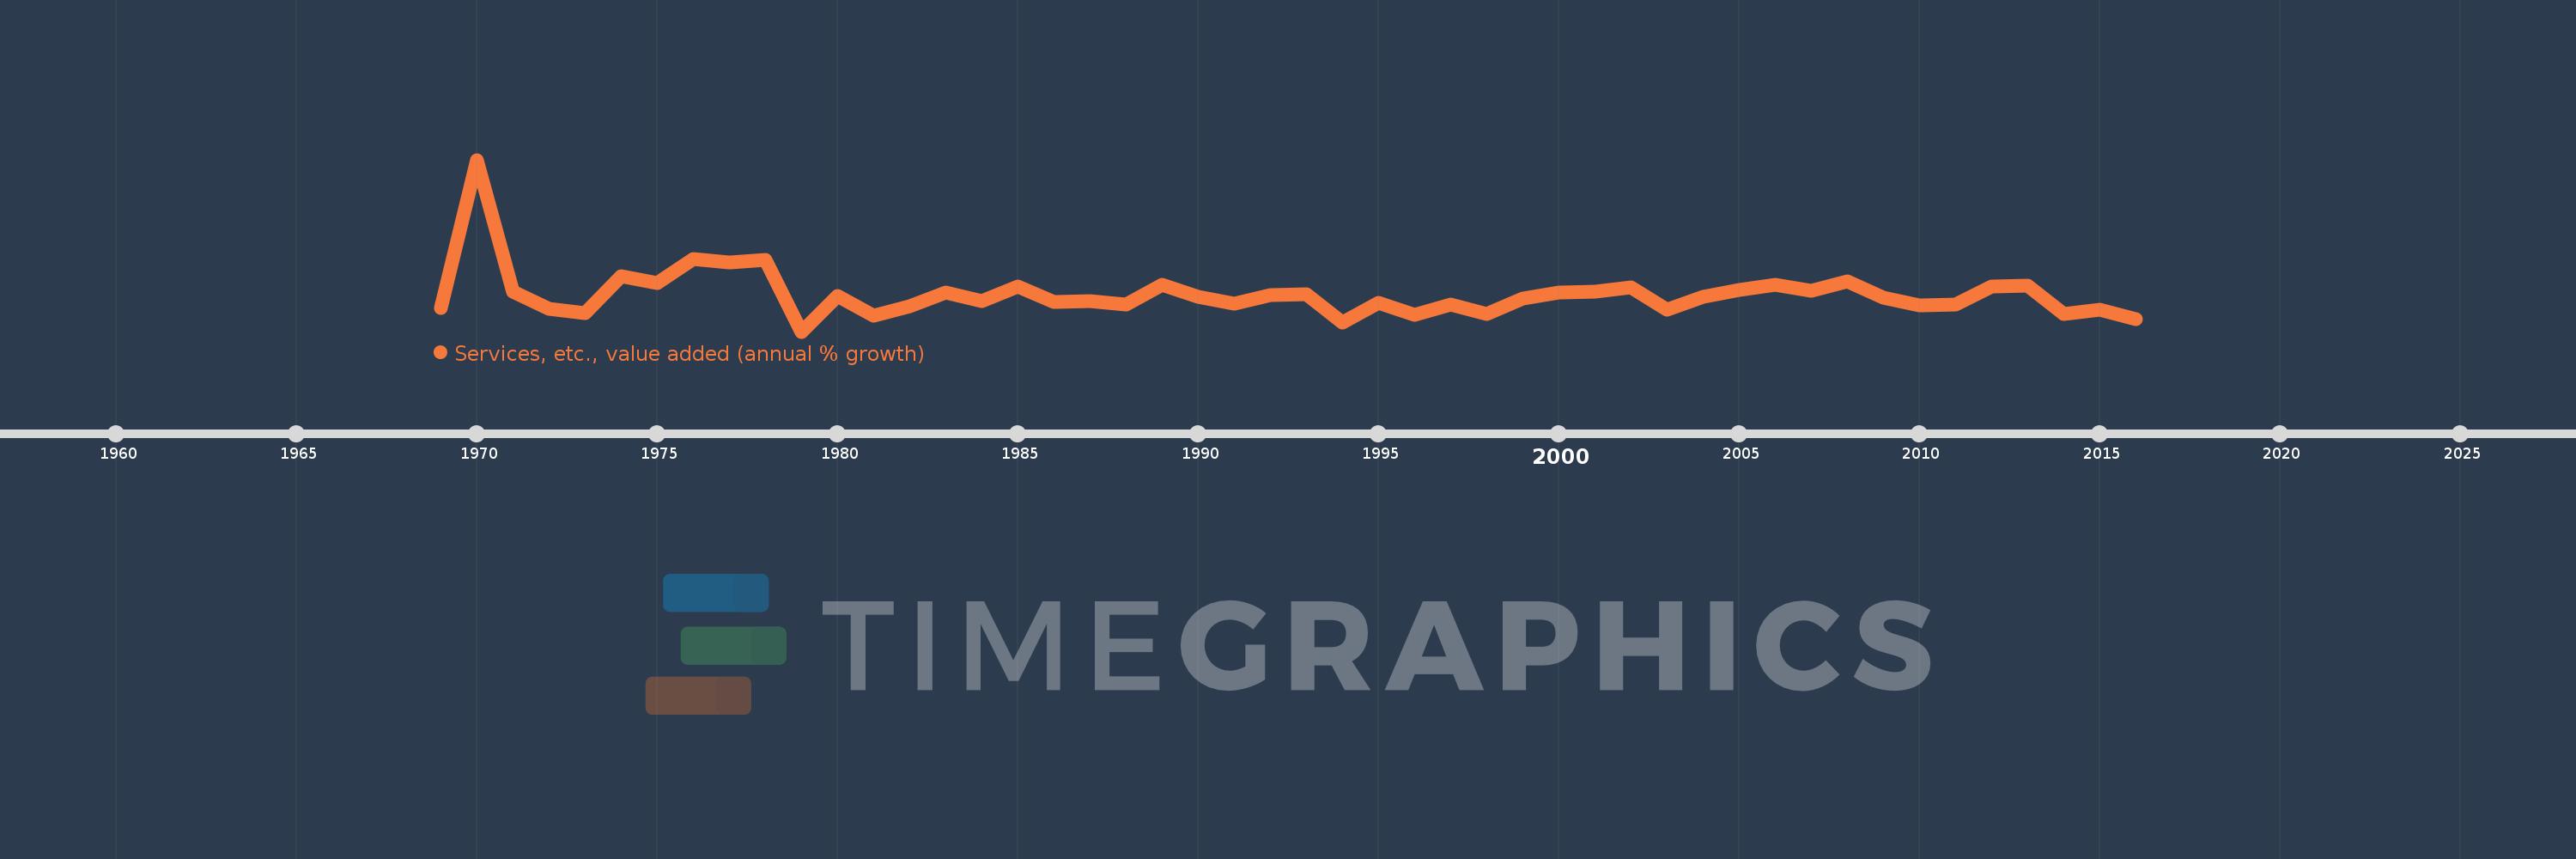
Services, etc., value added (annual % growth)
2016,2015,2014,2013,2012,2011,2010,2009,2008,2007,2006,2005,2004,2003,2002,2001,2000,1999,1998,1997,1996,1995,1994,1993,1992,1991,1990,1989,1988,1987,1986,1985,1984,1983,1982,1981,1980,1979,1978,1977,1976,1975,1974,1973,1972,1971,1970,1969
This statistics in other country:
AfghanistanAlbaniaAlgeriaAntigua and BarbudaArab WorldArgentinaArmeniaAustraliaAustriaAzerbaijanBahamas, TheBahrainBangladeshBelarusBelgiumBelizeBeninBermudaBhutanBoliviaBosnia and HerzegovinaBotswanaBrazilBrunei DarussalamBulgariaBurkina FasoBurundiCabo VerdeCambodiaCameroonCanadaCaribbean small statesCentral African RepublicCentral Europe and the BalticsChadChileChinaColombiaComorosCongo, Dem. Rep.Congo, Rep.Costa RicaCote d'IvoireCroatiaCubaCyprusCzech RepublicDenmarkDjiboutiDominicaDominican RepublicEarly-demographic dividendEast Asia & PacificEast Asia & Pacific (excluding high income)East Asia & Pacific (IDA & IBRD countries)EcuadorEgypt, Arab Rep.El SalvadorEquatorial GuineaEritreaEstoniaEthiopiaEuro areaEurope & Central AsiaEurope & Central Asia (excluding high income)Europe & Central Asia (IDA & IBRD countries)European UnionFijiFinlandFragile and conflict affected situationsFranceGabonGambia, TheGeorgiaGermanyGhanaGreeceGrenadaGuatemalaGuineaGuinea-BissauGuyanaHaitiHeavily indebted poor countries (HIPC)High incomeHondurasHong Kong SAR, ChinaHungaryIBRD onlyIcelandIDA & IBRD totalIDA blendIDA onlyIDA totalIndiaIndonesiaIran, Islamic Rep.IraqIrelandItalyJamaicaJapanJordanKazakhstanKenyaKiribatiKorea, Rep.KosovoKuwaitKyrgyz RepublicLao PDRLate-demographic dividendLatin America & Caribbean Latin America & Caribbean (excluding high income)Latin America & the Caribbean (IDA & IBRD countries)LatviaLeast developed countries: UN classificationLebanonLesothoLiberiaLithuaniaLow & middle incomeLow incomeLower middle incomeLuxembourgMacedonia, FYRMadagascarMalawiMalaysiaMaldivesMaliMarshall IslandsMauritaniaMauritiusMexicoMicronesia, Fed. Sts.Middle East & North AfricaMiddle East & North Africa (excluding high income)Middle East & North Africa (IDA & IBRD countries)Middle incomeMoldovaMongoliaMontenegroMoroccoMozambiqueMyanmarNamibiaNepalNetherlandsNew ZealandNicaraguaNigerNigeriaNorth AmericaNorwayOECD membersOmanOther small statesPacific island small statesPakistanPalauPanamaPapua New GuineaParaguayPeruPhilippinesPolandPortugalPost-demographic dividendPre-demographic dividendPuerto RicoQatarRomaniaRussian FederationRwandaSamoaSao Tome and PrincipeSaudi ArabiaSenegalSerbiaSeychellesSierra LeoneSingaporeSlovak RepublicSloveniaSmall statesSolomon IslandsSomaliaSouth AfricaSouth AsiaSouth Asia (IDA & IBRD)SpainSri LankaSt. Kitts and NevisSt. LuciaSt. Vincent and the GrenadinesSub-Saharan Africa Sub-Saharan Africa (excluding high income)Sub-Saharan Africa (IDA & IBRD countries)SudanSurinameSwazilandSwedenSwitzerlandSyrian Arab RepublicTajikistanTanzaniaThailandTimor-LesteTogoTongaTrinidad and TobagoTunisiaTurkeyTurkmenistanTuvaluUgandaUkraineUnited Arab EmiratesUnited KingdomUnited StatesUpper middle incomeUruguayUzbekistanVanuatuVenezuela, RBVietnamWest Bank and GazaWorldZambiaZimbabwe Timeline:
This timeline shows a graph from 1969 to 2016 of Morocco. No data until 1968. Number of actual observations by date: 48.
Source name:
World Development Indicators
Source organization:
World Bank national accounts data, and OECD National Accounts data files.
Categories, topics:
Economy & Growth
Last updated:
apr 23, 2017
Indicators value changes by year
Minimum:
-1.183
jan 1, 1979
Maximum:
27.014
jan 1, 1970
At the date of observation
Value
Absolute change
Change from previous value
jan 1, 1969
2.639
+2.639
0.0%
jan 1, 1970
27.014
+24.375
923.76%
jan 1, 1971
5.38
-21.633
-80.08%
jan 1, 1972
2.494
-2.887
-53.66%
jan 1, 1973
1.872
-0.622
-24.93%
jan 1, 1974
7.906
+6.034
322.33%
jan 1, 1975
6.781
-1.125
-14.23%
jan 1, 1976
10.692
+3.912
57.69%
jan 1, 1977
10.131
-0.561
-5.25%
jan 1, 1978
10.648
+0.517
5.1%
jan 1, 1979
-1.183
-11.832
-111.11%
jan 1, 1980
4.668
+5.851
-494.48%
jan 1, 1981
1.413
-3.255
-69.73%
jan 1, 1982
2.951
+1.538
108.81%
jan 1, 1983
5.296
+2.345
79.48%
jan 1, 1984
3.752
-1.543
-29.14%
jan 1, 1985
6.268
+2.515
67.03%
jan 1, 1986
3.668
-2.6
-41.48%
jan 1, 1987
3.792
+0.124
3.38%
jan 1, 1988
3.23
-0.562
-14.81%
jan 1, 1989
6.558
+3.328
103.02%
jan 1, 1990
4.588
-1.97
-30.05%
jan 1, 1991
3.395
-1.193
-26.0%
jan 1, 1992
4.85
+1.455
42.87%
jan 1, 1993
4.957
+0.107
2.2%
jan 1, 1994
0.305
-4.652
-93.85%
jan 1, 1995
3.608
+3.303
1.08K%
jan 1, 1996
1.628
-1.979
-54.86%
jan 1, 1997
3.287
+1.658
101.83%
jan 1, 1998
1.719
-1.567
-47.69%
jan 1, 1999
4.314
+2.595
150.91%
jan 1, 2000
5.274
+0.96
22.25%
jan 1, 2001
5.369
+0.095
1.8%
jan 1, 2002
6.081
+0.713
13.27%
jan 1, 2003
2.443
-3.639
-59.83%
jan 1, 2004
4.522
+2.08
85.13%
jan 1, 2005
5.646
+1.123
24.84%
jan 1, 2006
6.442
+0.796
14.11%
jan 1, 2007
5.487
-0.955
-14.82%
jan 1, 2008
7.003
+1.516
27.62%
jan 1, 2009
4.428
-2.575
-36.77%
jan 1, 2010
3.187
-1.241
-28.03%
jan 1, 2011
3.279
+0.092
2.89%
jan 1, 2012
6.186
+2.907
88.64%
jan 1, 2013
6.426
+0.24
3.88%
jan 1, 2014
1.668
-4.758
-74.05%
jan 1, 2015
2.479
+0.811
48.65%
jan 1, 2016
0.873
-1.606
-64.77%
Ranking of countries by current statistics by years


Comments: