29
/
en
AIzaSyAYiBZKx7MnpbEhh9jyipgxe19OcubqV5w
April 1, 2024
40344
IDA total
IDA
false
2
1
Services, etc., value added (annual % growth)
2016,2015,2014,2013,2012,2011,2010,2009,2008,2007,2006,2005,2004,2003,2002,2001,2000,1999,1998,1997,1996,1995,1994,1993,1992,1991,1990,1989,1988,1987,1986,1985,1984,1983
This statistics in other country:
AfghanistanAlbaniaAlgeriaAntigua and BarbudaArab WorldArgentinaArmeniaAustraliaAustriaAzerbaijanBahamas, TheBahrainBangladeshBelarusBelgiumBelizeBeninBermudaBhutanBoliviaBosnia and HerzegovinaBotswanaBrazilBrunei DarussalamBulgariaBurkina FasoBurundiCabo VerdeCambodiaCameroonCanadaCaribbean small statesCentral African RepublicCentral Europe and the BalticsChadChileChinaColombiaComorosCongo, Dem. Rep.Congo, Rep.Costa RicaCote d'IvoireCroatiaCubaCyprusCzech RepublicDenmarkDjiboutiDominicaDominican RepublicEarly-demographic dividendEast Asia & PacificEast Asia & Pacific (excluding high income)East Asia & Pacific (IDA & IBRD countries)EcuadorEgypt, Arab Rep.El SalvadorEquatorial GuineaEritreaEstoniaEthiopiaEuro areaEurope & Central AsiaEurope & Central Asia (excluding high income)Europe & Central Asia (IDA & IBRD countries)European UnionFijiFinlandFragile and conflict affected situationsFranceGabonGambia, TheGeorgiaGermanyGhanaGreeceGrenadaGuatemalaGuineaGuinea-BissauGuyanaHaitiHeavily indebted poor countries (HIPC)High incomeHondurasHong Kong SAR, ChinaHungaryIBRD onlyIcelandIDA & IBRD totalIDA blendIDA onlyIDA totalIndiaIndonesiaIran, Islamic Rep.IraqIrelandItalyJamaicaJapanJordanKazakhstanKenyaKiribatiKorea, Rep.KosovoKuwaitKyrgyz RepublicLao PDRLate-demographic dividendLatin America & Caribbean Latin America & Caribbean (excluding high income)Latin America & the Caribbean (IDA & IBRD countries)LatviaLeast developed countries: UN classificationLebanonLesothoLiberiaLithuaniaLow & middle incomeLow incomeLower middle incomeLuxembourgMacedonia, FYRMadagascarMalawiMalaysiaMaldivesMaliMarshall IslandsMauritaniaMauritiusMexicoMicronesia, Fed. Sts.Middle East & North AfricaMiddle East & North Africa (excluding high income)Middle East & North Africa (IDA & IBRD countries)Middle incomeMoldovaMongoliaMontenegroMoroccoMozambiqueMyanmarNamibiaNepalNetherlandsNew ZealandNicaraguaNigerNigeriaNorth AmericaNorwayOECD membersOmanOther small statesPacific island small statesPakistanPalauPanamaPapua New GuineaParaguayPeruPhilippinesPolandPortugalPost-demographic dividendPre-demographic dividendPuerto RicoQatarRomaniaRussian FederationRwandaSamoaSao Tome and PrincipeSaudi ArabiaSenegalSerbiaSeychellesSierra LeoneSingaporeSlovak RepublicSloveniaSmall statesSolomon IslandsSomaliaSouth AfricaSouth AsiaSouth Asia (IDA & IBRD)SpainSri LankaSt. Kitts and NevisSt. LuciaSt. Vincent and the GrenadinesSub-Saharan Africa Sub-Saharan Africa (excluding high income)Sub-Saharan Africa (IDA & IBRD countries)SudanSurinameSwazilandSwedenSwitzerlandSyrian Arab RepublicTajikistanTanzaniaThailandTimor-LesteTogoTongaTrinidad and TobagoTunisiaTurkeyTurkmenistanTuvaluUgandaUkraineUnited Arab EmiratesUnited KingdomUnited StatesUpper middle incomeUruguayUzbekistanVanuatuVenezuela, RBVietnamWest Bank and GazaWorldZambiaZimbabwe Timeline:
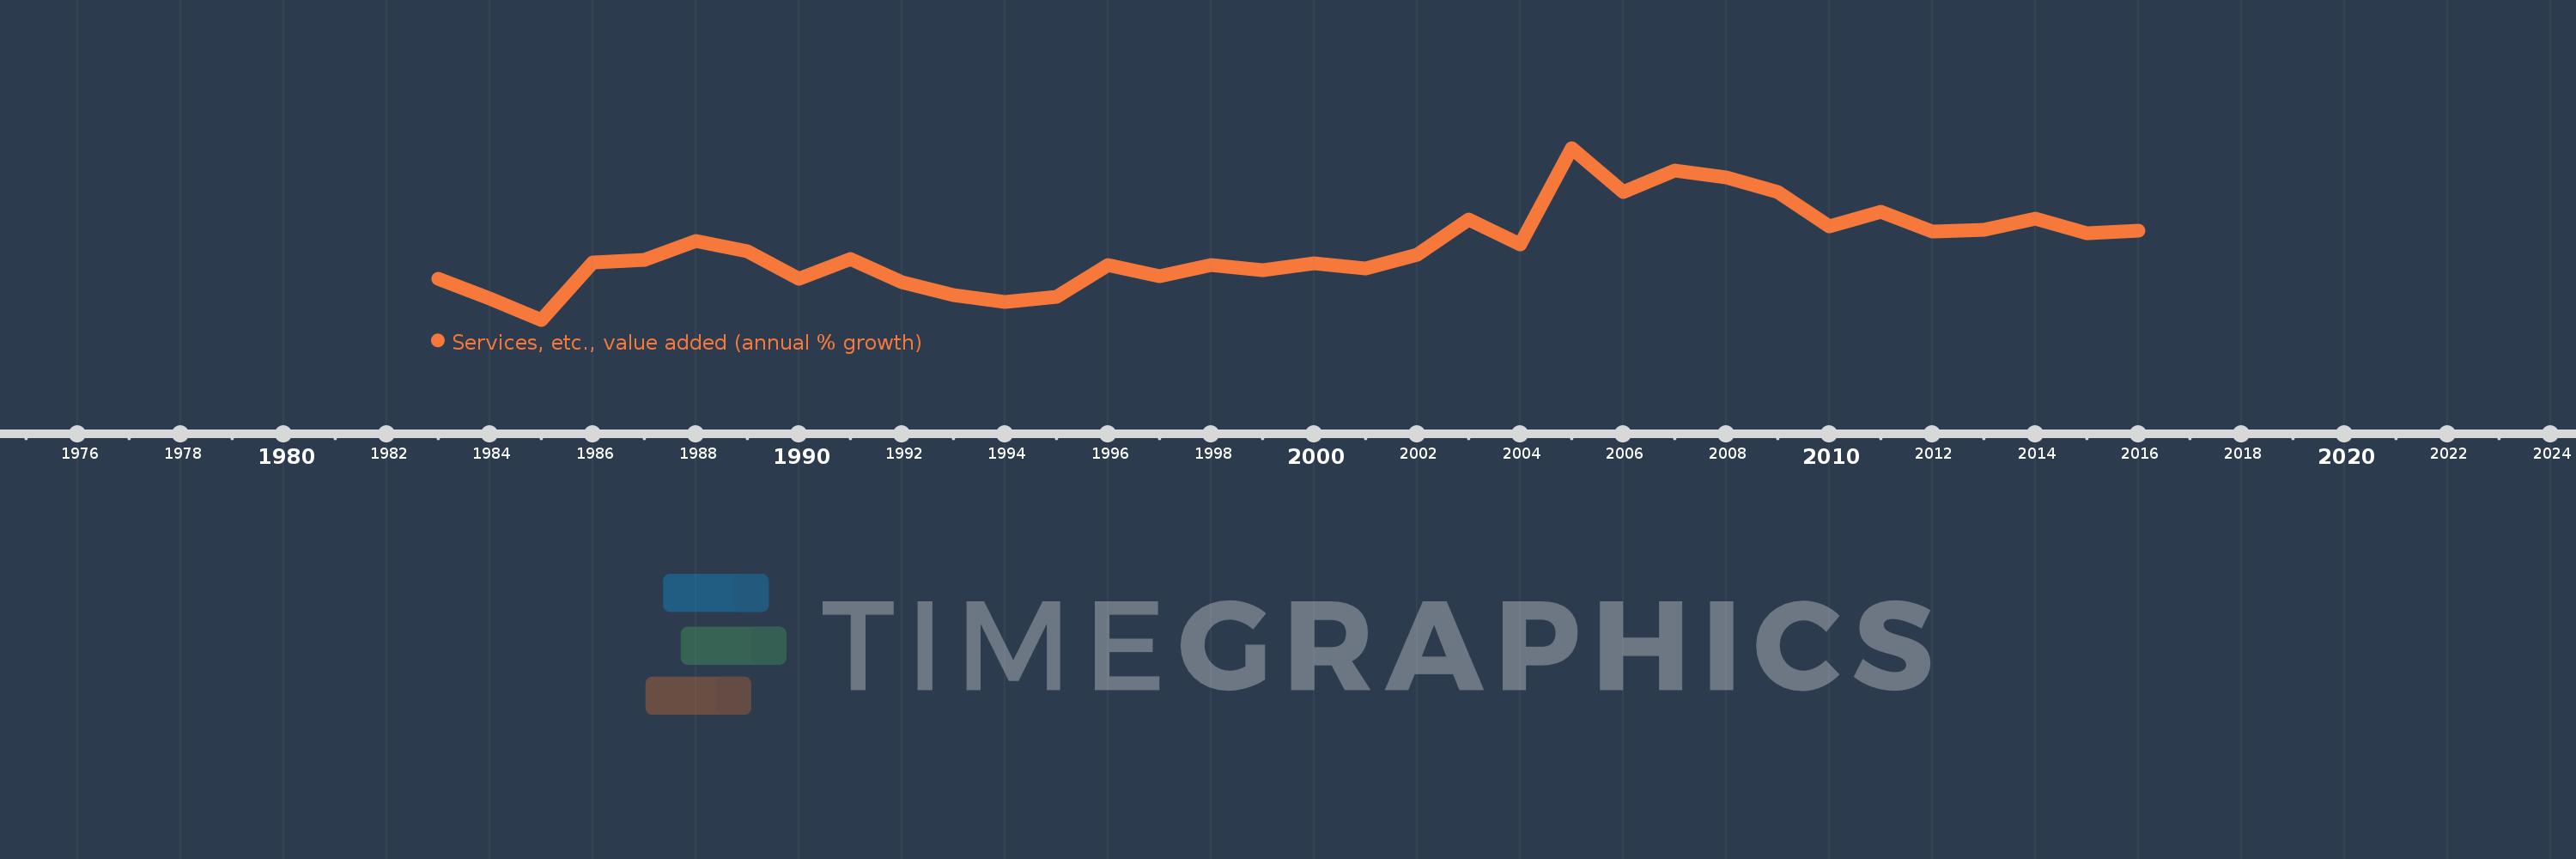
This timeline shows a graph from 1983 to 2016 of IDA total. No data until 1982. Number of actual observations by date: 34.
Source name:
World Development Indicators
Source organization:
World Bank national accounts data, and OECD National Accounts data files.
Categories, topics:
Economy & Growth
Last updated:
apr 23, 2017
Indicators value changes by year
Maximum:
10.737
jan 1, 2005
At the date of observation
Value
Absolute change
Change from previous value
jan 1, 1983
3.122
+3.122
0.0%
jan 1, 1984
1.964
-1.158
-37.09%
jan 1, 1985
0.729
-1.235
-62.87%
jan 1, 1986
4.043
+3.314
454.32%
jan 1, 1987
4.192
+0.149
3.69%
jan 1, 1988
5.32
+1.128
26.9%
jan 1, 1989
4.719
-0.6
-11.28%
jan 1, 1990
3.121
-1.599
-33.88%
jan 1, 1991
4.277
+1.156
37.04%
jan 1, 1992
2.898
-1.379
-32.23%
jan 1, 1993
2.178
-0.72
-24.84%
jan 1, 1994
1.788
-0.39
-17.92%
jan 1, 1995
2.045
+0.258
14.4%
jan 1, 1996
3.903
+1.858
90.85%
jan 1, 1997
3.258
-0.645
-16.52%
jan 1, 1998
3.933
+0.675
20.7%
jan 1, 1999
3.594
-0.339
-8.62%
jan 1, 2000
4.0
+0.406
11.3%
jan 1, 2001
3.727
-0.274
-6.84%
jan 1, 2002
4.514
+0.787
21.13%
jan 1, 2003
6.572
+2.058
45.6%
jan 1, 2004
5.123
-1.449
-22.05%
jan 1, 2005
10.737
+5.614
109.58%
jan 1, 2006
8.168
-2.569
-23.93%
jan 1, 2007
9.428
+1.261
15.44%
jan 1, 2008
9.038
-0.39
-4.14%
jan 1, 2009
8.158
-0.88
-9.74%
jan 1, 2010
6.153
-2.004
-24.57%
jan 1, 2011
6.999
+0.846
13.75%
jan 1, 2012
5.85
-1.149
-16.42%
jan 1, 2013
5.951
+0.101
1.73%
jan 1, 2014
6.62
+0.669
11.24%
jan 1, 2015
5.749
-0.872
-13.17%
jan 1, 2016
5.922
+0.173
3.01%
Ranking of countries by current statistics by years


Comments: