29
/
en
AIzaSyAYiBZKx7MnpbEhh9jyipgxe19OcubqV5w
April 1, 2024
253676
Sudan
SDN
true
2
1
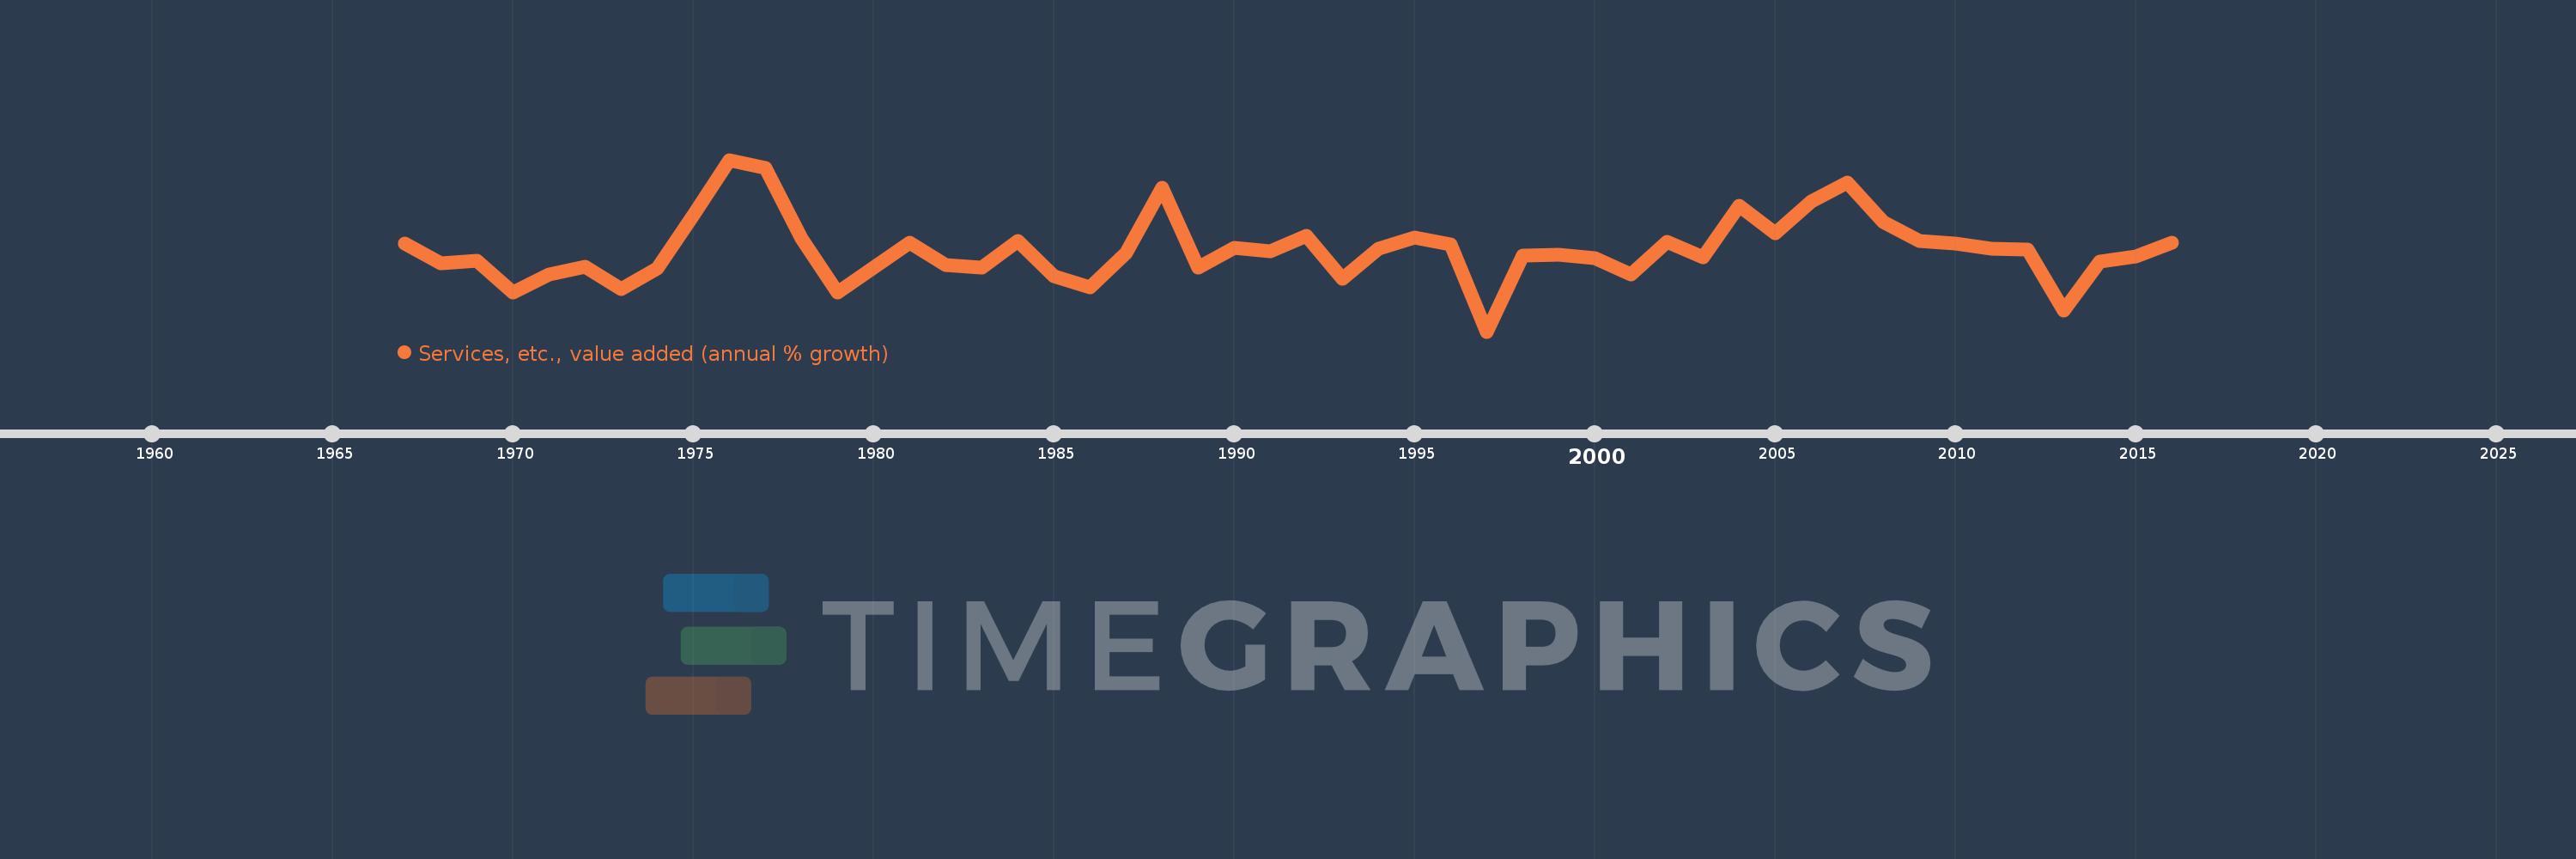
Services, etc., value added (annual % growth)
2016,2015,2014,2013,2012,2011,2010,2009,2008,2007,2006,2005,2004,2003,2002,2001,2000,1999,1998,1997,1996,1995,1994,1993,1992,1991,1990,1989,1988,1987,1986,1985,1984,1983,1982,1981,1980,1979,1978,1977,1976,1975,1974,1973,1972,1971,1970,1969,1968,1967
This statistics in other country:
AfghanistanAlbaniaAlgeriaAntigua and BarbudaArab WorldArgentinaArmeniaAustraliaAustriaAzerbaijanBahamas, TheBahrainBangladeshBelarusBelgiumBelizeBeninBermudaBhutanBoliviaBosnia and HerzegovinaBotswanaBrazilBrunei DarussalamBulgariaBurkina FasoBurundiCabo VerdeCambodiaCameroonCanadaCaribbean small statesCentral African RepublicCentral Europe and the BalticsChadChileChinaColombiaComorosCongo, Dem. Rep.Congo, Rep.Costa RicaCote d'IvoireCroatiaCubaCyprusCzech RepublicDenmarkDjiboutiDominicaDominican RepublicEarly-demographic dividendEast Asia & PacificEast Asia & Pacific (excluding high income)East Asia & Pacific (IDA & IBRD countries)EcuadorEgypt, Arab Rep.El SalvadorEquatorial GuineaEritreaEstoniaEthiopiaEuro areaEurope & Central AsiaEurope & Central Asia (excluding high income)Europe & Central Asia (IDA & IBRD countries)European UnionFijiFinlandFragile and conflict affected situationsFranceGabonGambia, TheGeorgiaGermanyGhanaGreeceGrenadaGuatemalaGuineaGuinea-BissauGuyanaHaitiHeavily indebted poor countries (HIPC)High incomeHondurasHong Kong SAR, ChinaHungaryIBRD onlyIcelandIDA & IBRD totalIDA blendIDA onlyIDA totalIndiaIndonesiaIran, Islamic Rep.IraqIrelandItalyJamaicaJapanJordanKazakhstanKenyaKiribatiKorea, Rep.KosovoKuwaitKyrgyz RepublicLao PDRLate-demographic dividendLatin America & Caribbean Latin America & Caribbean (excluding high income)Latin America & the Caribbean (IDA & IBRD countries)LatviaLeast developed countries: UN classificationLebanonLesothoLiberiaLithuaniaLow & middle incomeLow incomeLower middle incomeLuxembourgMacedonia, FYRMadagascarMalawiMalaysiaMaldivesMaliMarshall IslandsMauritaniaMauritiusMexicoMicronesia, Fed. Sts.Middle East & North AfricaMiddle East & North Africa (excluding high income)Middle East & North Africa (IDA & IBRD countries)Middle incomeMoldovaMongoliaMontenegroMoroccoMozambiqueMyanmarNamibiaNepalNetherlandsNew ZealandNicaraguaNigerNigeriaNorth AmericaNorwayOECD membersOmanOther small statesPacific island small statesPakistanPalauPanamaPapua New GuineaParaguayPeruPhilippinesPolandPortugalPost-demographic dividendPre-demographic dividendPuerto RicoQatarRomaniaRussian FederationRwandaSamoaSao Tome and PrincipeSaudi ArabiaSenegalSerbiaSeychellesSierra LeoneSingaporeSlovak RepublicSloveniaSmall statesSolomon IslandsSomaliaSouth AfricaSouth AsiaSouth Asia (IDA & IBRD)SpainSri LankaSt. Kitts and NevisSt. LuciaSt. Vincent and the GrenadinesSub-Saharan Africa Sub-Saharan Africa (excluding high income)Sub-Saharan Africa (IDA & IBRD countries)SudanSurinameSwazilandSwedenSwitzerlandSyrian Arab RepublicTajikistanTanzaniaThailandTimor-LesteTogoTongaTrinidad and TobagoTunisiaTurkeyTurkmenistanTuvaluUgandaUkraineUnited Arab EmiratesUnited KingdomUnited StatesUpper middle incomeUruguayUzbekistanVanuatuVenezuela, RBVietnamWest Bank and GazaWorldZambiaZimbabwe Timeline:
This timeline shows a graph from 1967 to 2016 of Sudan. No data until 1966. Number of actual observations by date: 50.
Source name:
World Development Indicators
Source organization:
World Bank national accounts data, and OECD National Accounts data files.
Categories, topics:
Economy & Growth
Last updated:
apr 23, 2017
Indicators value changes by year
Maximum:
24.514
jan 1, 1976
At the date of observation
Value
Absolute change
Change from previous value
jan 1, 1967
6.251
+6.251
0.0%
jan 1, 1968
1.872
-4.379
-70.05%
jan 1, 1969
2.509
+0.637
34.02%
jan 1, 1970
-4.383
-6.892
-274.67%
jan 1, 1971
-0.468
+3.915
-89.32%
jan 1, 1972
1.074
+1.542
-329.55%
jan 1, 1973
-3.691
-4.765
-443.55%
jan 1, 1974
0.771
+4.462
-120.89%
jan 1, 1975
12.425
+11.654
1.51K%
jan 1, 1976
24.514
+12.09
97.3%
jan 1, 1977
22.729
-1.785
-7.28%
jan 1, 1978
7.356
-15.373
-67.64%
jan 1, 1979
-4.409
-11.765
-159.95%
jan 1, 1980
0.933
+5.342
-121.15%
jan 1, 1981
6.42
+5.487
588.36%
jan 1, 1982
1.574
-4.846
-75.48%
jan 1, 1983
0.977
-0.597
-37.93%
jan 1, 1984
6.848
+5.871
600.92%
jan 1, 1985
-0.881
-7.729
-112.87%
jan 1, 1986
-3.392
-2.511
284.99%
jan 1, 1987
4.195
+7.586
-223.67%
jan 1, 1988
18.326
+14.131
336.89%
jan 1, 1989
1.016
-17.31
-94.46%
jan 1, 1990
5.297
+4.281
421.49%
jan 1, 1991
4.619
-0.678
-12.8%
jan 1, 1992
7.908
+3.289
71.21%
jan 1, 1993
-1.502
-9.41
-118.99%
jan 1, 1994
5.026
+6.528
-434.62%
jan 1, 1995
7.524
+2.498
49.71%
jan 1, 1996
5.999
-1.526
-20.28%
jan 1, 1997
-13.0
-18.999
-316.72%
jan 1, 1998
3.665
+16.665
-128.19%
jan 1, 1999
3.842
+0.177
4.82%
jan 1, 2000
3.063
-0.779
-20.28%
jan 1, 2001
-0.541
-3.603
-117.66%
jan 1, 2002
6.644
+7.185
-1.33K%
jan 1, 2003
3.31
-3.334
-50.18%
jan 1, 2004
14.446
+11.136
336.43%
jan 1, 2005
8.519
-5.927
-41.03%
jan 1, 2006
15.385
+6.866
80.6%
jan 1, 2007
19.592
+4.207
27.34%
jan 1, 2008
10.908
-8.684
-44.32%
jan 1, 2009
6.792
-4.116
-37.73%
jan 1, 2010
6.216
-0.576
-8.48%
jan 1, 2011
5.083
-1.133
-18.23%
jan 1, 2012
4.846
-0.237
-4.66%
jan 1, 2013
-8.471
-13.317
-274.79%
jan 1, 2014
2.209
+10.679
-126.08%
jan 1, 2015
3.431
+1.222
55.31%
jan 1, 2016
6.357
+2.927
85.31%
Ranking of countries by current statistics by years


Comments: