29
/
en
AIzaSyAYiBZKx7MnpbEhh9jyipgxe19OcubqV5w
April 1, 2024
157954
Iran, Islamic Rep.
IRN
true
2
1
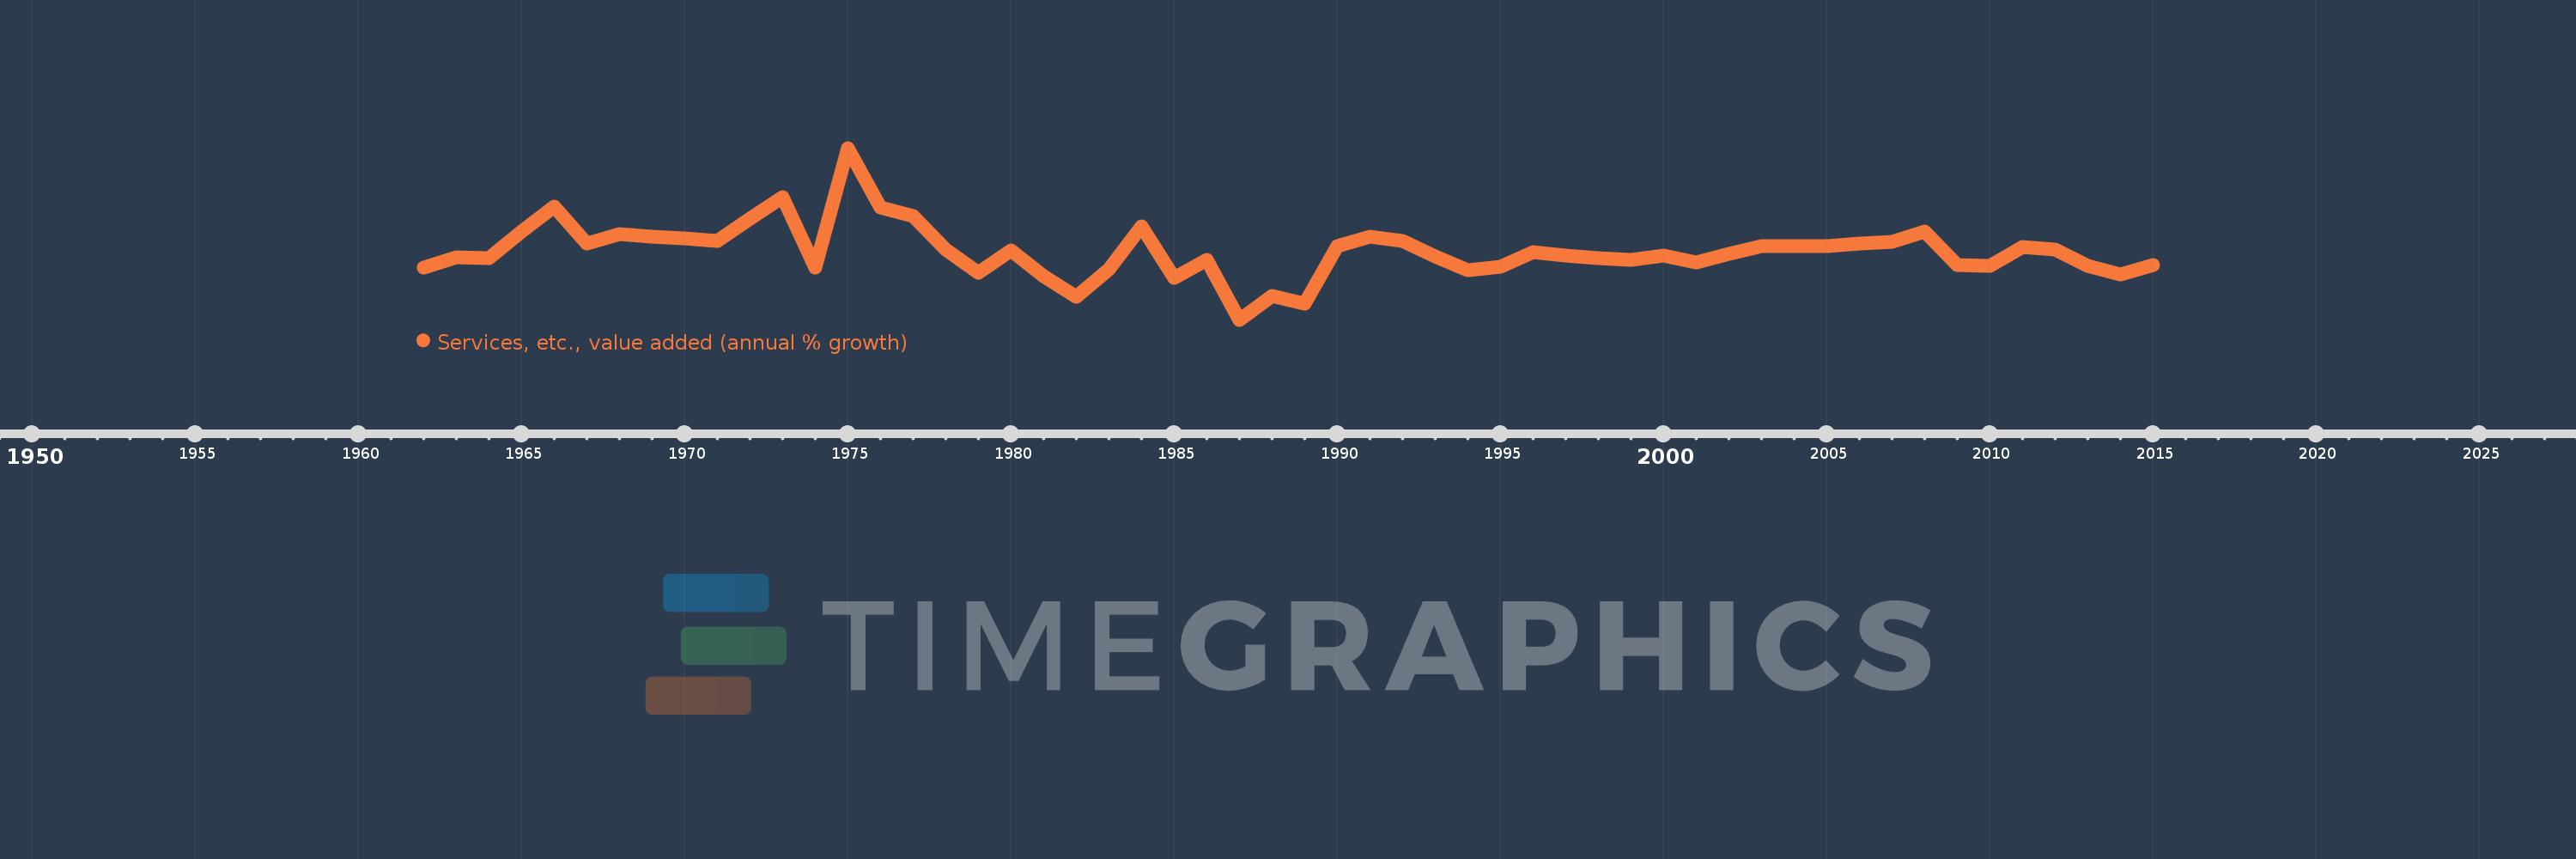
Services, etc., value added (annual % growth)
2015,2014,2013,2012,2011,2010,2009,2008,2007,2006,2005,2004,2003,2002,2001,2000,1999,1998,1997,1996,1995,1994,1993,1992,1991,1990,1989,1988,1987,1986,1985,1984,1983,1982,1981,1980,1979,1978,1977,1976,1975,1974,1973,1972,1971,1970,1969,1968,1967,1966,1965,1964,1963,1962
This statistics in other country:
AfghanistanAlbaniaAlgeriaAntigua and BarbudaArab WorldArgentinaArmeniaAustraliaAustriaAzerbaijanBahamas, TheBahrainBangladeshBelarusBelgiumBelizeBeninBermudaBhutanBoliviaBosnia and HerzegovinaBotswanaBrazilBrunei DarussalamBulgariaBurkina FasoBurundiCabo VerdeCambodiaCameroonCanadaCaribbean small statesCentral African RepublicCentral Europe and the BalticsChadChileChinaColombiaComorosCongo, Dem. Rep.Congo, Rep.Costa RicaCote d'IvoireCroatiaCubaCyprusCzech RepublicDenmarkDjiboutiDominicaDominican RepublicEarly-demographic dividendEast Asia & PacificEast Asia & Pacific (excluding high income)East Asia & Pacific (IDA & IBRD countries)EcuadorEgypt, Arab Rep.El SalvadorEquatorial GuineaEritreaEstoniaEthiopiaEuro areaEurope & Central AsiaEurope & Central Asia (excluding high income)Europe & Central Asia (IDA & IBRD countries)European UnionFijiFinlandFragile and conflict affected situationsFranceGabonGambia, TheGeorgiaGermanyGhanaGreeceGrenadaGuatemalaGuineaGuinea-BissauGuyanaHaitiHeavily indebted poor countries (HIPC)High incomeHondurasHong Kong SAR, ChinaHungaryIBRD onlyIcelandIDA & IBRD totalIDA blendIDA onlyIDA totalIndiaIndonesiaIran, Islamic Rep.IraqIrelandItalyJamaicaJapanJordanKazakhstanKenyaKiribatiKorea, Rep.KosovoKuwaitKyrgyz RepublicLao PDRLate-demographic dividendLatin America & Caribbean Latin America & Caribbean (excluding high income)Latin America & the Caribbean (IDA & IBRD countries)LatviaLeast developed countries: UN classificationLebanonLesothoLiberiaLithuaniaLow & middle incomeLow incomeLower middle incomeLuxembourgMacedonia, FYRMadagascarMalawiMalaysiaMaldivesMaliMarshall IslandsMauritaniaMauritiusMexicoMicronesia, Fed. Sts.Middle East & North AfricaMiddle East & North Africa (excluding high income)Middle East & North Africa (IDA & IBRD countries)Middle incomeMoldovaMongoliaMontenegroMoroccoMozambiqueMyanmarNamibiaNepalNetherlandsNew ZealandNicaraguaNigerNigeriaNorth AmericaNorwayOECD membersOmanOther small statesPacific island small statesPakistanPalauPanamaPapua New GuineaParaguayPeruPhilippinesPolandPortugalPost-demographic dividendPre-demographic dividendPuerto RicoQatarRomaniaRussian FederationRwandaSamoaSao Tome and PrincipeSaudi ArabiaSenegalSerbiaSeychellesSierra LeoneSingaporeSlovak RepublicSloveniaSmall statesSolomon IslandsSomaliaSouth AfricaSouth AsiaSouth Asia (IDA & IBRD)SpainSri LankaSt. Kitts and NevisSt. LuciaSt. Vincent and the GrenadinesSub-Saharan Africa Sub-Saharan Africa (excluding high income)Sub-Saharan Africa (IDA & IBRD countries)SudanSurinameSwazilandSwedenSwitzerlandSyrian Arab RepublicTajikistanTanzaniaThailandTimor-LesteTogoTongaTrinidad and TobagoTunisiaTurkeyTurkmenistanTuvaluUgandaUkraineUnited Arab EmiratesUnited KingdomUnited StatesUpper middle incomeUruguayUzbekistanVanuatuVenezuela, RBVietnamWest Bank and GazaWorldZambiaZimbabwe Timeline:
This timeline shows a graph from 1962 to 2015 of Iran, Islamic Rep.. No data until 1961. Number of actual observations by date: 54.
Source name:
World Development Indicators
Source organization:
World Bank national accounts data, and OECD National Accounts data files.
Categories, topics:
Economy & Growth
Last updated:
apr 23, 2017
Indicators value changes by year
Minimum:
-13.774
jan 1, 1987
Maximum:
34.848
jan 1, 1975
At the date of observation
Value
Absolute change
Change from previous value
jan 1, 1962
0.987
+0.987
0.0%
jan 1, 1963
3.849
+2.862
289.9%
jan 1, 1964
3.735
-0.114
-2.97%
jan 1, 1965
11.156
+7.421
198.68%
jan 1, 1966
18.203
+7.047
63.17%
jan 1, 1967
7.683
-10.52
-57.79%
jan 1, 1968
10.369
+2.686
34.95%
jan 1, 1969
9.784
-0.584
-5.64%
jan 1, 1970
9.29
-0.494
-5.05%
jan 1, 1971
8.562
-0.729
-7.84%
jan 1, 1972
14.91
+6.348
74.15%
jan 1, 1973
20.964
+6.054
40.6%
jan 1, 1974
0.92
-20.044
-95.61%
jan 1, 1975
34.848
+33.929
3.69K%
jan 1, 1976
17.93
-16.918
-48.55%
jan 1, 1977
15.536
-2.394
-13.35%
jan 1, 1978
6.151
-9.385
-60.41%
jan 1, 1979
-0.411
-6.562
-106.69%
jan 1, 1980
5.771
+6.183
-1.5K%
jan 1, 1981
-1.354
-7.125
-123.46%
jan 1, 1982
-7.365
-6.011
443.97%
jan 1, 1983
0.539
+7.903
-107.31%
jan 1, 1984
12.56
+12.022
2.23K%
jan 1, 1985
-2.007
-14.568
-115.98%
jan 1, 1986
3.2
+5.208
-259.42%
jan 1, 1987
-13.774
-16.974
-530.39%
jan 1, 1988
-7.159
+6.615
-48.03%
jan 1, 1989
-9.289
-2.131
29.76%
jan 1, 1990
7.172
+16.461
-177.21%
jan 1, 1991
9.812
+2.64
36.81%
jan 1, 1992
8.636
-1.176
-11.99%
jan 1, 1993
4.239
-4.397
-50.92%
jan 1, 1994
0.206
-4.032
-95.13%
jan 1, 1995
1.281
+1.074
520.43%
jan 1, 1996
5.449
+4.169
325.51%
jan 1, 1997
4.432
-1.017
-18.67%
jan 1, 1998
3.59
-0.842
-19.0%
jan 1, 1999
3.274
-0.316
-8.81%
jan 1, 2000
4.471
+1.197
36.57%
jan 1, 2001
2.504
-1.967
-44.0%
jan 1, 2002
4.892
+2.389
95.4%
jan 1, 2003
7.064
+2.172
44.4%
jan 1, 2004
7.123
+0.058
0.83%
jan 1, 2005
7.168
+0.045
0.64%
jan 1, 2006
7.82
+0.651
9.09%
jan 1, 2007
8.252
+0.432
5.53%
jan 1, 2008
11.076
+2.824
34.22%
jan 1, 2009
1.729
-9.347
-84.39%
jan 1, 2010
1.388
-0.341
-19.74%
jan 1, 2011
6.719
+5.332
384.18%
jan 1, 2012
6.205
-0.514
-7.65%
jan 1, 2013
1.354
-4.851
-78.18%
jan 1, 2014
-0.842
-2.196
-162.15%
jan 1, 2015
1.672
+2.514
-298.69%
Ranking of countries by current statistics by years


Comments: