29
/
en
AIzaSyAYiBZKx7MnpbEhh9jyipgxe19OcubqV5w
April 1, 2024
122860
Dominican Republic
DOM
true
2
1
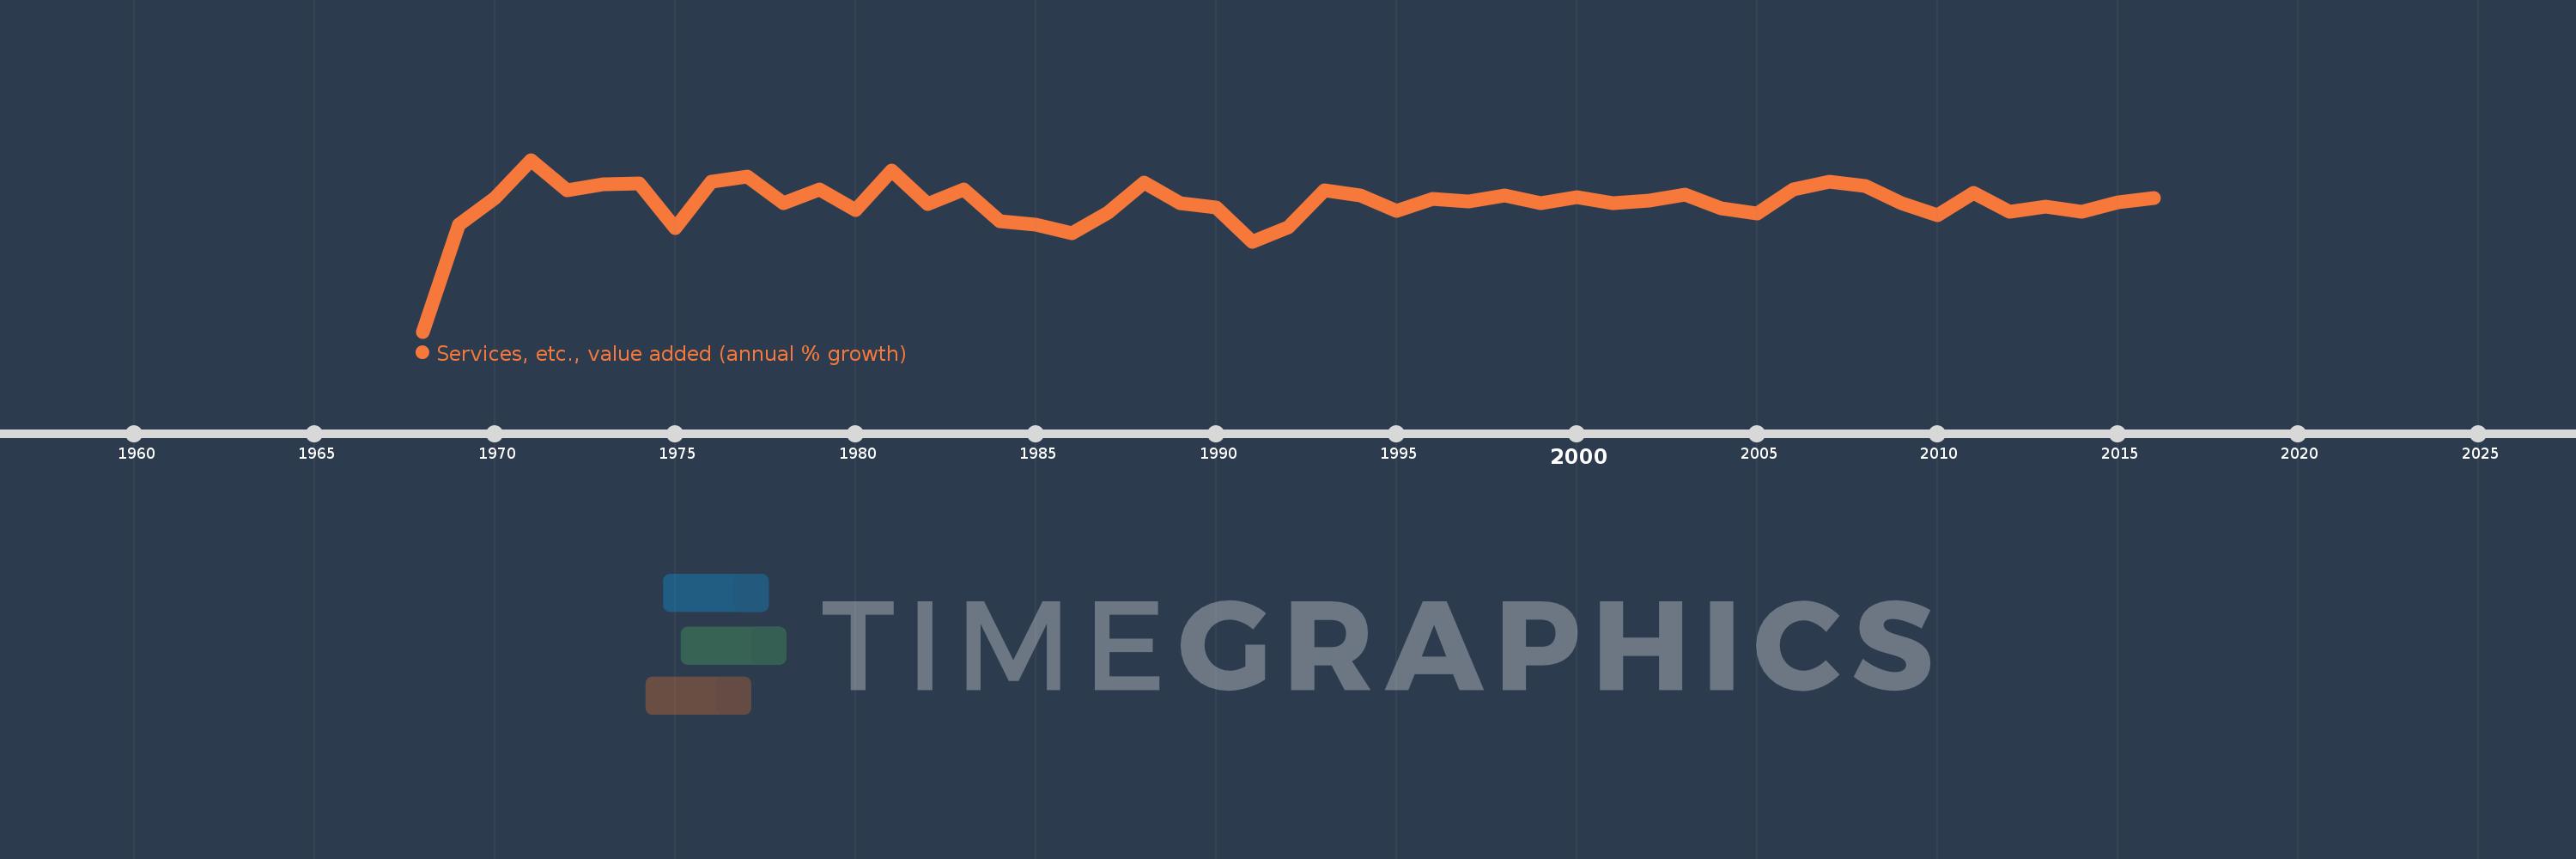
Services, etc., value added (annual % growth)
2016,2015,2014,2013,2012,2011,2010,2009,2008,2007,2006,2005,2004,2003,2002,2001,2000,1999,1998,1997,1996,1995,1994,1993,1992,1991,1990,1989,1988,1987,1986,1985,1984,1983,1982,1981,1980,1979,1978,1977,1976,1975,1974,1973,1972,1971,1970,1969,1968
This statistics in other country:
AfghanistanAlbaniaAlgeriaAntigua and BarbudaArab WorldArgentinaArmeniaAustraliaAustriaAzerbaijanBahamas, TheBahrainBangladeshBelarusBelgiumBelizeBeninBermudaBhutanBoliviaBosnia and HerzegovinaBotswanaBrazilBrunei DarussalamBulgariaBurkina FasoBurundiCabo VerdeCambodiaCameroonCanadaCaribbean small statesCentral African RepublicCentral Europe and the BalticsChadChileChinaColombiaComorosCongo, Dem. Rep.Congo, Rep.Costa RicaCote d'IvoireCroatiaCubaCyprusCzech RepublicDenmarkDjiboutiDominicaDominican RepublicEarly-demographic dividendEast Asia & PacificEast Asia & Pacific (excluding high income)East Asia & Pacific (IDA & IBRD countries)EcuadorEgypt, Arab Rep.El SalvadorEquatorial GuineaEritreaEstoniaEthiopiaEuro areaEurope & Central AsiaEurope & Central Asia (excluding high income)Europe & Central Asia (IDA & IBRD countries)European UnionFijiFinlandFragile and conflict affected situationsFranceGabonGambia, TheGeorgiaGermanyGhanaGreeceGrenadaGuatemalaGuineaGuinea-BissauGuyanaHaitiHeavily indebted poor countries (HIPC)High incomeHondurasHong Kong SAR, ChinaHungaryIBRD onlyIcelandIDA & IBRD totalIDA blendIDA onlyIDA totalIndiaIndonesiaIran, Islamic Rep.IraqIrelandItalyJamaicaJapanJordanKazakhstanKenyaKiribatiKorea, Rep.KosovoKuwaitKyrgyz RepublicLao PDRLate-demographic dividendLatin America & Caribbean Latin America & Caribbean (excluding high income)Latin America & the Caribbean (IDA & IBRD countries)LatviaLeast developed countries: UN classificationLebanonLesothoLiberiaLithuaniaLow & middle incomeLow incomeLower middle incomeLuxembourgMacedonia, FYRMadagascarMalawiMalaysiaMaldivesMaliMarshall IslandsMauritaniaMauritiusMexicoMicronesia, Fed. Sts.Middle East & North AfricaMiddle East & North Africa (excluding high income)Middle East & North Africa (IDA & IBRD countries)Middle incomeMoldovaMongoliaMontenegroMoroccoMozambiqueMyanmarNamibiaNepalNetherlandsNew ZealandNicaraguaNigerNigeriaNorth AmericaNorwayOECD membersOmanOther small statesPacific island small statesPakistanPalauPanamaPapua New GuineaParaguayPeruPhilippinesPolandPortugalPost-demographic dividendPre-demographic dividendPuerto RicoQatarRomaniaRussian FederationRwandaSamoaSao Tome and PrincipeSaudi ArabiaSenegalSerbiaSeychellesSierra LeoneSingaporeSlovak RepublicSloveniaSmall statesSolomon IslandsSomaliaSouth AfricaSouth AsiaSouth Asia (IDA & IBRD)SpainSri LankaSt. Kitts and NevisSt. LuciaSt. Vincent and the GrenadinesSub-Saharan Africa Sub-Saharan Africa (excluding high income)Sub-Saharan Africa (IDA & IBRD countries)SudanSurinameSwazilandSwedenSwitzerlandSyrian Arab RepublicTajikistanTanzaniaThailandTimor-LesteTogoTongaTrinidad and TobagoTunisiaTurkeyTurkmenistanTuvaluUgandaUkraineUnited Arab EmiratesUnited KingdomUnited StatesUpper middle incomeUruguayUzbekistanVanuatuVenezuela, RBVietnamWest Bank and GazaWorldZambiaZimbabwe Timeline:
This timeline shows a graph from 1968 to 2016 of Dominican Republic. No data until 1967. Number of actual observations by date: 49.
Source name:
World Development Indicators
Source organization:
World Bank national accounts data, and OECD National Accounts data files.
Categories, topics:
Economy & Growth
Last updated:
apr 23, 2017
Indicators value changes by year
Maximum:
16.432
jan 1, 1971
At the date of observation
Value
Absolute change
Change from previous value
jan 1, 1968
-27.8
-27.8
0.0%
jan 1, 1969
-0.252
+27.549
-99.09%
jan 1, 1970
6.635
+6.887
-2.74K%
jan 1, 1971
16.432
+9.797
147.65%
jan 1, 1972
8.609
-7.822
-47.61%
jan 1, 1973
10.058
+1.448
16.82%
jan 1, 1974
10.246
+0.189
1.87%
jan 1, 1975
-1.085
-11.331
-110.59%
jan 1, 1976
10.692
+11.777
-1.09K%
jan 1, 1977
12.015
+1.322
12.37%
jan 1, 1978
5.373
-6.642
-55.28%
jan 1, 1979
8.749
+3.376
62.84%
jan 1, 1980
3.46
-5.289
-60.45%
jan 1, 1981
13.73
+10.269
296.8%
jan 1, 1982
5.086
-8.644
-62.96%
jan 1, 1983
8.768
+3.682
72.39%
jan 1, 1984
0.563
-8.205
-93.58%
jan 1, 1985
-0.278
-0.841
-149.31%
jan 1, 1986
-2.52
-2.242
807.49%
jan 1, 1987
2.911
+5.431
-215.5%
jan 1, 1988
10.518
+7.608
261.39%
jan 1, 1989
5.321
-5.198
-49.42%
jan 1, 1990
4.184
-1.137
-21.36%
jan 1, 1991
-4.673
-8.857
-211.68%
jan 1, 1992
-0.943
+3.73
-79.81%
jan 1, 1993
8.614
+9.557
-1.01K%
jan 1, 1994
7.255
-1.359
-15.78%
jan 1, 1995
3.252
-4.003
-55.18%
jan 1, 1996
6.363
+3.112
95.69%
jan 1, 1997
5.786
-0.577
-9.07%
jan 1, 1998
7.347
+1.56
26.97%
jan 1, 1999
5.165
-2.182
-29.69%
jan 1, 2000
6.777
+1.612
31.2%
jan 1, 2001
5.36
-1.417
-20.92%
jan 1, 2002
5.87
+0.51
9.52%
jan 1, 2003
7.46
+1.59
27.08%
jan 1, 2004
4.032
-3.428
-45.95%
jan 1, 2005
2.696
-1.335
-33.12%
jan 1, 2006
8.831
+6.135
227.52%
jan 1, 2007
10.85
+2.02
22.87%
jan 1, 2008
9.726
-1.125
-10.36%
jan 1, 2009
5.198
-4.528
-46.55%
jan 1, 2010
2.25
-2.948
-56.71%
jan 1, 2011
7.862
+5.612
249.39%
jan 1, 2012
3.005
-4.857
-61.78%
jan 1, 2013
4.428
+1.423
47.34%
jan 1, 2014
3.158
-1.27
-28.68%
jan 1, 2015
5.537
+2.379
75.33%
jan 1, 2016
6.546
+1.01
18.24%
Ranking of countries by current statistics by years


Comments: