29
/
en
AIzaSyAYiBZKx7MnpbEhh9jyipgxe19OcubqV5w
April 1, 2024
91412
Brazil
BRA
true
2
1
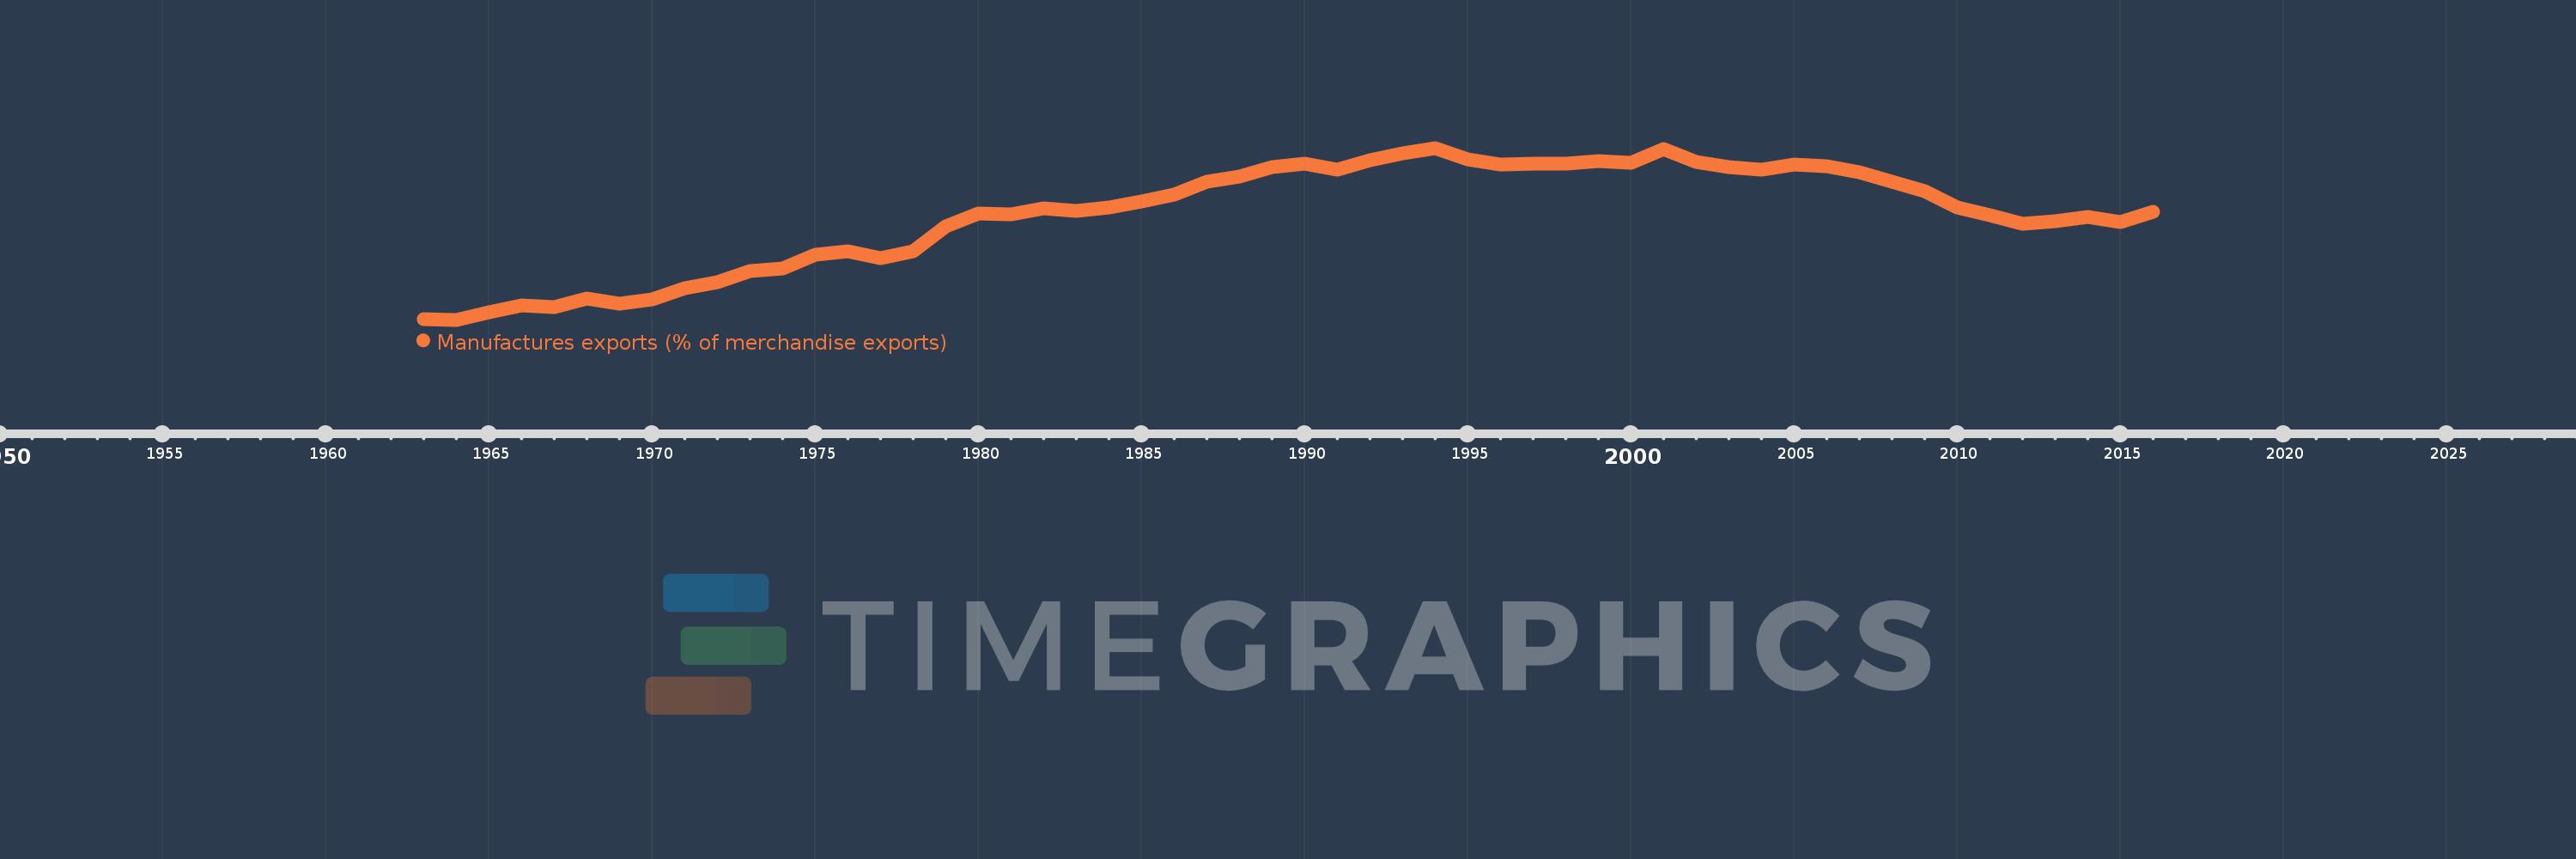
Manufactures exports (% of merchandise exports)
2016,2015,2014,2013,2012,2011,2010,2009,2008,2007,2006,2005,2004,2003,2002,2001,2000,1999,1998,1997,1996,1995,1994,1993,1992,1991,1990,1989,1988,1987,1986,1985,1984,1983,1982,1981,1980,1979,1978,1977,1976,1975,1974,1973,1972,1971,1970,1969,1968,1967,1966,1965,1964,1963
This statistics in other country:
AfghanistanAlbaniaAlgeriaAndorraAngolaAntigua and BarbudaArab WorldArgentinaArmeniaArubaAustraliaAustriaAzerbaijanBahamas, TheBahrainBangladeshBarbadosBelarusBelgiumBelizeBeninBermudaBhutanBoliviaBosnia and HerzegovinaBotswanaBrazilBrunei DarussalamBulgariaBurkina FasoBurundiCabo VerdeCambodiaCameroonCanadaCaribbean small statesCayman IslandsCentral African RepublicCentral Europe and the BalticsChadChileChinaColombiaComorosCongo, Dem. Rep.Congo, Rep.Costa RicaCote d'IvoireCroatiaCubaCyprusCzech RepublicDenmarkDjiboutiDominicaDominican RepublicEarly-demographic dividendEast Asia & PacificEast Asia & Pacific (excluding high income)East Asia & Pacific (IDA & IBRD countries)EcuadorEgypt, Arab Rep.El SalvadorEquatorial GuineaEritreaEstoniaEthiopiaEuro areaEurope & Central AsiaEurope & Central Asia (excluding high income)Europe & Central Asia (IDA & IBRD countries)European UnionFaroe IslandsFijiFinlandFragile and conflict affected situationsFranceFrench PolynesiaGabonGambia, TheGeorgiaGermanyGhanaGreeceGreenlandGrenadaGuatemalaGuineaGuinea-BissauGuyanaHaitiHeavily indebted poor countries (HIPC)High incomeHondurasHong Kong SAR, ChinaHungaryIBRD onlyIcelandIDA & IBRD totalIDA blendIDA onlyIDA totalIndiaIndonesiaIran, Islamic Rep.IraqIrelandIsraelItalyJamaicaJapanJordanKazakhstanKenyaKiribatiKorea, Rep.KuwaitKyrgyz RepublicLao PDRLate-demographic dividendLatin America & Caribbean Latin America & Caribbean (excluding high income)Latin America & the Caribbean (IDA & IBRD countries)LatviaLeast developed countries: UN classificationLebanonLesothoLiberiaLibyaLithuaniaLow & middle incomeLower middle incomeLuxembourgMacao SAR, ChinaMacedonia, FYRMadagascarMalawiMalaysiaMaldivesMaliMaltaMauritaniaMauritiusMexicoMiddle East & North AfricaMiddle East & North Africa (excluding high income)Middle East & North Africa (IDA & IBRD countries)Middle incomeMoldovaMongoliaMoroccoMozambiqueMyanmarNamibiaNepalNetherlandsNew CaledoniaNew ZealandNicaraguaNigerNigeriaNorth AmericaNorwayOECD membersOmanOther small statesPacific island small statesPakistanPalauPanamaPapua New GuineaParaguayPeruPhilippinesPolandPortugalPost-demographic dividendPre-demographic dividendQatarRomaniaRussian FederationRwandaSamoaSao Tome and PrincipeSaudi ArabiaSenegalSerbiaSeychellesSierra LeoneSingaporeSlovak RepublicSloveniaSmall statesSolomon IslandsSomaliaSouth AfricaSouth AsiaSouth Asia (IDA & IBRD)SpainSri LankaSt. Kitts and NevisSt. LuciaSt. Vincent and the GrenadinesSub-Saharan Africa Sub-Saharan Africa (excluding high income)Sub-Saharan Africa (IDA & IBRD countries)SudanSurinameSwazilandSwedenSwitzerlandSyrian Arab RepublicTajikistanTanzaniaThailandTimor-LesteTogoTongaTrinidad and TobagoTunisiaTurkeyTurkmenistanTurks and Caicos IslandsTuvaluUgandaUkraineUnited Arab EmiratesUnited KingdomUnited StatesUpper middle incomeUruguayVanuatuVenezuela, RBVietnamVirgin Islands (U.S.)WorldYemen, Rep.ZambiaZimbabwe Timeline:
This timeline shows a graph from 1963 to 2016 of Brazil. No data until 1962. Number of actual observations by date: 54.
Source name:
World Development Indicators
Source organization:
World Bank staff estimates from the Comtrade database maintained by the United Nations Statistics Division.
Categories, topics:
Private Sector, Trade
Last updated:
apr 23, 2017
Indicators value changes by year
Maximum:
58.864
jan 1, 1994
At the date of observation
Value
Absolute change
Change from previous value
jan 1, 1963
3.071
+3.071
0.0%
jan 1, 1964
2.962
-0.108
-3.53%
jan 1, 1965
5.337
+2.375
80.17%
jan 1, 1966
7.739
+2.402
45.01%
jan 1, 1967
7.133
-0.607
-7.84%
jan 1, 1968
9.846
+2.713
38.03%
jan 1, 1969
8.116
-1.73
-17.57%
jan 1, 1970
9.69
+1.575
19.4%
jan 1, 1971
13.235
+3.545
36.58%
jan 1, 1972
15.191
+1.956
14.78%
jan 1, 1973
18.765
+3.574
23.53%
jan 1, 1974
19.629
+0.864
4.6%
jan 1, 1975
24.156
+4.527
23.06%
jan 1, 1976
25.289
+1.133
4.69%
jan 1, 1977
23.029
-2.26
-8.94%
jan 1, 1978
25.116
+2.087
9.06%
jan 1, 1979
33.275
+8.16
32.49%
jan 1, 1980
37.609
+4.333
13.02%
jan 1, 1981
37.214
-0.395
-1.05%
jan 1, 1982
39.107
+1.893
5.09%
jan 1, 1983
38.273
-0.834
-2.13%
jan 1, 1984
39.36
+1.087
2.84%
jan 1, 1985
41.326
+1.966
5.0%
jan 1, 1986
43.744
+2.418
5.85%
jan 1, 1987
47.942
+4.198
9.6%
jan 1, 1988
49.585
+1.643
3.43%
jan 1, 1989
52.514
+2.929
5.91%
jan 1, 1990
53.851
+1.336
2.54%
jan 1, 1991
51.916
-1.934
-3.59%
jan 1, 1992
54.862
+2.946
5.67%
jan 1, 1993
56.97
+2.108
3.84%
jan 1, 1994
58.864
+1.893
3.32%
jan 1, 1995
55.06
-3.803
-6.46%
jan 1, 1996
53.533
-1.527
-2.77%
jan 1, 1997
53.757
+0.224
0.42%
jan 1, 1998
53.655
-0.102
-0.19%
jan 1, 1999
54.665
+1.01
1.88%
jan 1, 2000
54.067
-0.598
-1.09%
jan 1, 2001
58.432
+4.365
8.07%
jan 1, 2002
54.303
-4.128
-7.07%
jan 1, 2003
52.62
-1.683
-3.1%
jan 1, 2004
51.818
-0.802
-1.52%
jan 1, 2005
53.352
+1.534
2.96%
jan 1, 2006
52.964
-0.388
-0.73%
jan 1, 2007
50.826
-2.137
-4.04%
jan 1, 2008
47.85
-2.977
-5.86%
jan 1, 2009
44.849
-3.001
-6.27%
jan 1, 2010
39.468
-5.381
-12.0%
jan 1, 2011
37.059
-2.409
-6.1%
jan 1, 2012
34.123
-2.935
-7.92%
jan 1, 2013
35.04
+0.916
2.69%
jan 1, 2014
36.369
+1.329
3.79%
jan 1, 2015
34.8
-1.569
-4.31%
jan 1, 2016
38.088
+3.288
9.45%
Ranking of countries by current statistics by years


Comments: