29
/
en
AIzaSyAYiBZKx7MnpbEhh9jyipgxe19OcubqV5w
April 1, 2024
92777
Brunei Darussalam
BRN
true
2
1
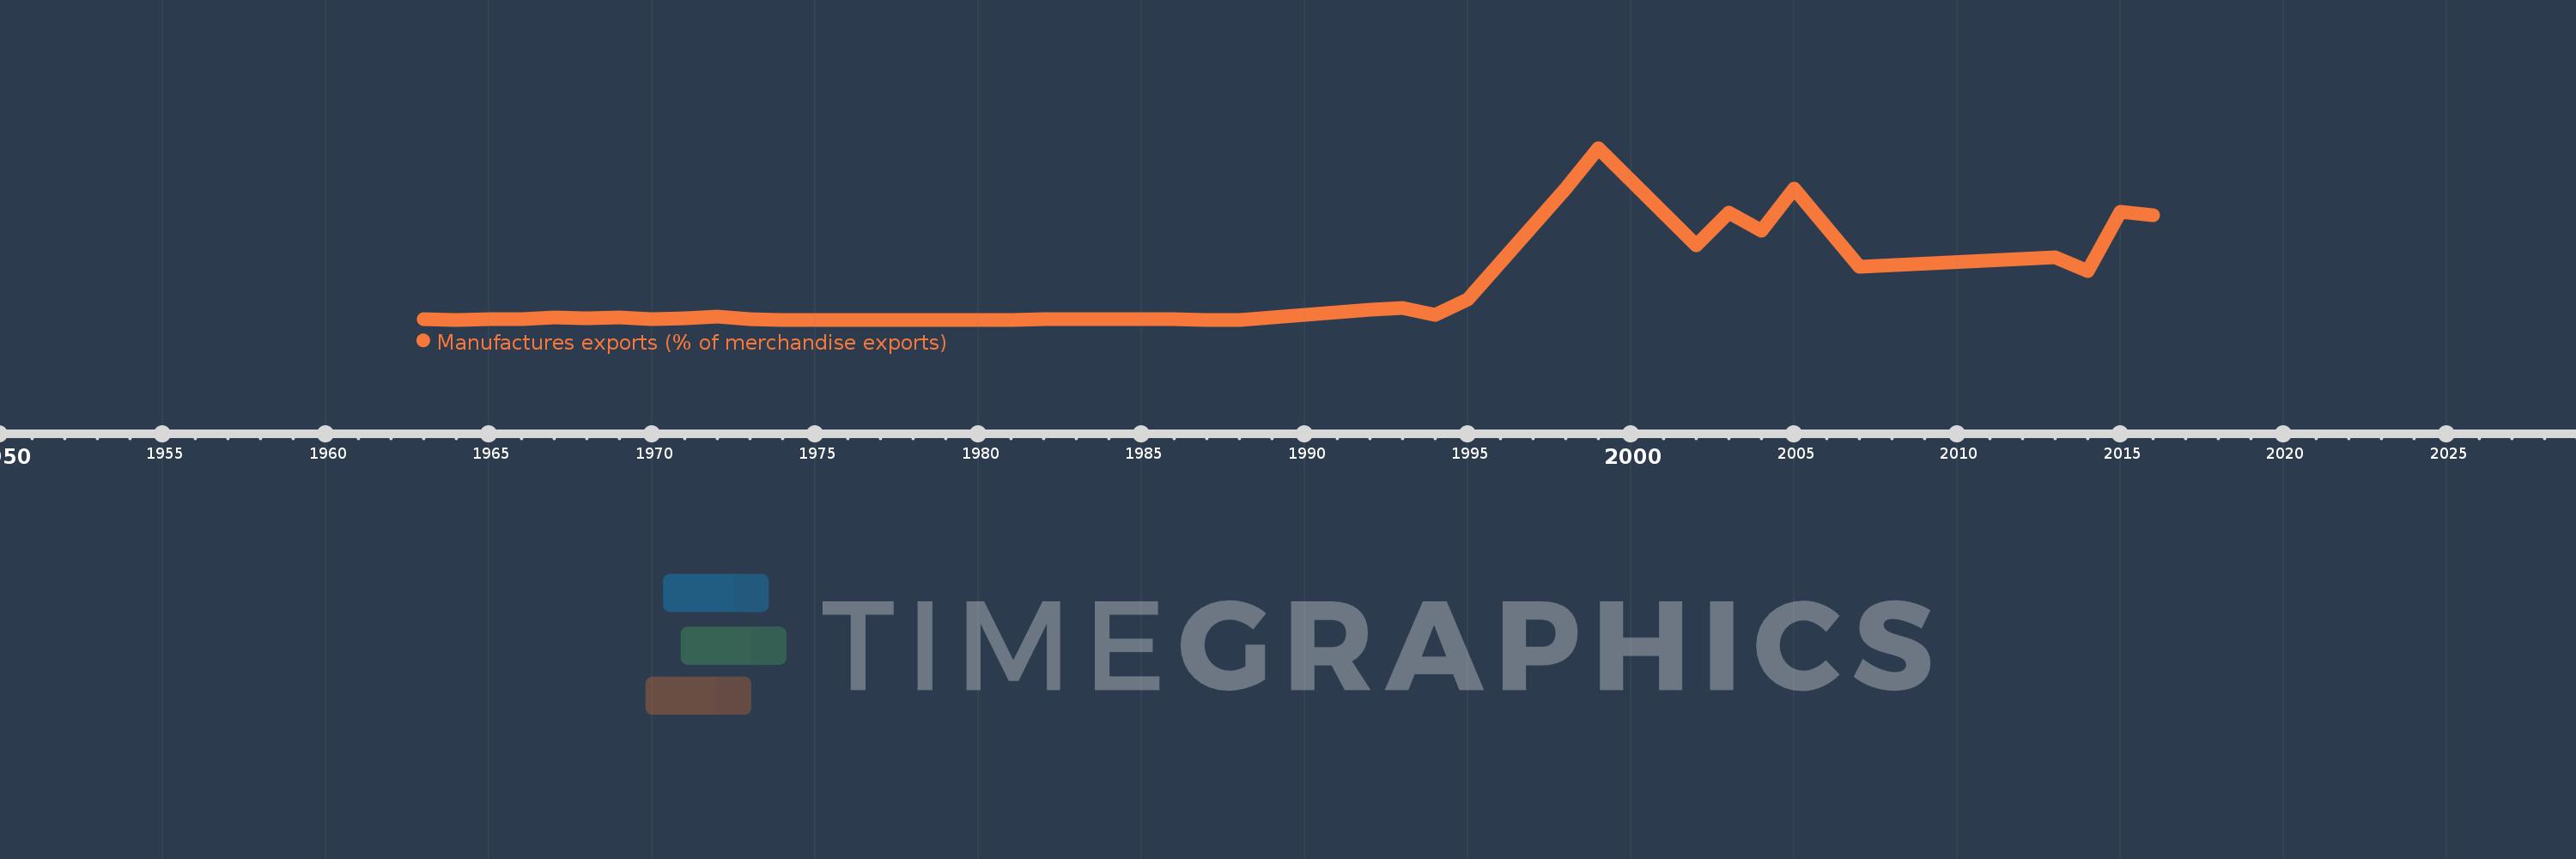
Manufactures exports (% of merchandise exports)
2016,2015,2014,2013,2007,2005,2004,2003,2002,1999,1998,1995,1994,1993,1992,1991,1990,1989,1988,1987,1986,1985,1984,1983,1982,1981,1980,1979,1978,1977,1976,1975,1974,1973,1972,1971,1970,1969,1968,1967,1966,1965,1964,1963
This statistics in other country:
AfghanistanAlbaniaAlgeriaAndorraAngolaAntigua and BarbudaArab WorldArgentinaArmeniaArubaAustraliaAustriaAzerbaijanBahamas, TheBahrainBangladeshBarbadosBelarusBelgiumBelizeBeninBermudaBhutanBoliviaBosnia and HerzegovinaBotswanaBrazilBrunei DarussalamBulgariaBurkina FasoBurundiCabo VerdeCambodiaCameroonCanadaCaribbean small statesCayman IslandsCentral African RepublicCentral Europe and the BalticsChadChileChinaColombiaComorosCongo, Dem. Rep.Congo, Rep.Costa RicaCote d'IvoireCroatiaCubaCyprusCzech RepublicDenmarkDjiboutiDominicaDominican RepublicEarly-demographic dividendEast Asia & PacificEast Asia & Pacific (excluding high income)East Asia & Pacific (IDA & IBRD countries)EcuadorEgypt, Arab Rep.El SalvadorEquatorial GuineaEritreaEstoniaEthiopiaEuro areaEurope & Central AsiaEurope & Central Asia (excluding high income)Europe & Central Asia (IDA & IBRD countries)European UnionFaroe IslandsFijiFinlandFragile and conflict affected situationsFranceFrench PolynesiaGabonGambia, TheGeorgiaGermanyGhanaGreeceGreenlandGrenadaGuatemalaGuineaGuinea-BissauGuyanaHaitiHeavily indebted poor countries (HIPC)High incomeHondurasHong Kong SAR, ChinaHungaryIBRD onlyIcelandIDA & IBRD totalIDA blendIDA onlyIDA totalIndiaIndonesiaIran, Islamic Rep.IraqIrelandIsraelItalyJamaicaJapanJordanKazakhstanKenyaKiribatiKorea, Rep.KuwaitKyrgyz RepublicLao PDRLate-demographic dividendLatin America & Caribbean Latin America & Caribbean (excluding high income)Latin America & the Caribbean (IDA & IBRD countries)LatviaLeast developed countries: UN classificationLebanonLesothoLiberiaLibyaLithuaniaLow & middle incomeLower middle incomeLuxembourgMacao SAR, ChinaMacedonia, FYRMadagascarMalawiMalaysiaMaldivesMaliMaltaMauritaniaMauritiusMexicoMiddle East & North AfricaMiddle East & North Africa (excluding high income)Middle East & North Africa (IDA & IBRD countries)Middle incomeMoldovaMongoliaMoroccoMozambiqueMyanmarNamibiaNepalNetherlandsNew CaledoniaNew ZealandNicaraguaNigerNigeriaNorth AmericaNorwayOECD membersOmanOther small statesPacific island small statesPakistanPalauPanamaPapua New GuineaParaguayPeruPhilippinesPolandPortugalPost-demographic dividendPre-demographic dividendQatarRomaniaRussian FederationRwandaSamoaSao Tome and PrincipeSaudi ArabiaSenegalSerbiaSeychellesSierra LeoneSingaporeSlovak RepublicSloveniaSmall statesSolomon IslandsSomaliaSouth AfricaSouth AsiaSouth Asia (IDA & IBRD)SpainSri LankaSt. Kitts and NevisSt. LuciaSt. Vincent and the GrenadinesSub-Saharan Africa Sub-Saharan Africa (excluding high income)Sub-Saharan Africa (IDA & IBRD countries)SudanSurinameSwazilandSwedenSwitzerlandSyrian Arab RepublicTajikistanTanzaniaThailandTimor-LesteTogoTongaTrinidad and TobagoTunisiaTurkeyTurkmenistanTurks and Caicos IslandsTuvaluUgandaUkraineUnited Arab EmiratesUnited KingdomUnited StatesUpper middle incomeUruguayVanuatuVenezuela, RBVietnamVirgin Islands (U.S.)WorldYemen, Rep.ZambiaZimbabwe Timeline:
This timeline shows a graph from 1963 to 2016 of Brunei Darussalam. No data until 1962. Number of actual observations by date: 44.
Source name:
World Development Indicators
Source organization:
World Bank staff estimates from the Comtrade database maintained by the United Nations Statistics Division.
Categories, topics:
Private Sector, Trade
Last updated:
apr 23, 2017
Indicators value changes by year
Maximum:
10.783
jan 1, 1999
At the date of observation
Value
Absolute change
Change from previous value
jan 1, 1963
0.032
+0.032
0.0%
jan 1, 1964
0.013
-0.019
-60.51%
jan 1, 1965
0.04
+0.028
221.66%
jan 1, 1966
0.02
-0.02
-50.57%
jan 1, 1967
0.144
+0.124
622.42%
jan 1, 1968
0.075
-0.069
-47.86%
jan 1, 1969
0.128
+0.053
70.25%
jan 1, 1970
0.052
-0.076
-59.2%
jan 1, 1971
0.071
+0.019
36.9%
jan 1, 1972
0.211
+0.14
195.69%
jan 1, 1973
0.037
-0.174
-82.42%
jan 1, 1974
0.009
-0.028
-76.16%
jan 1, 1975
0.01
+0.001
11.2%
jan 1, 1976
0.007
-0.003
-26.1%
jan 1, 1977
0.007
0.0
-3.87%
jan 1, 1978
0.004
-0.003
-44.24%
jan 1, 1979
0.005
+0.001
28.81%
jan 1, 1980
0.007
+0.002
39.84%
jan 1, 1981
0.013
+0.006
81.78%
jan 1, 1982
0.03
+0.017
136.46%
jan 1, 1983
0.025
-0.005
-17.27%
jan 1, 1984
0.033
+0.008
30.66%
jan 1, 1985
0.022
-0.011
-32.83%
jan 1, 1986
0.018
-0.004
-16.2%
jan 1, 1987
0.012
-0.006
-32.72%
jan 1, 1988
0.012
-0.001
-5.13%
jan 1, 1989
0.17
+0.159
1.36K%
jan 1, 1990
0.297
+0.127
74.55%
jan 1, 1991
0.471
+0.174
58.41%
jan 1, 1992
0.637
+0.166
35.27%
jan 1, 1993
0.727
+0.09
14.05%
jan 1, 1994
0.29
-0.437
-60.12%
jan 1, 1995
1.3
+1.01
348.52%
jan 1, 1998
8.226
+6.925
532.65%
jan 1, 1999
10.783
+2.557
31.09%
jan 1, 2002
4.677
-6.106
-56.62%
jan 1, 2003
6.737
+2.06
44.04%
jan 1, 2004
5.593
-1.144
-16.98%
jan 1, 2005
8.234
+2.641
47.21%
jan 1, 2007
3.321
-4.913
-59.66%
jan 1, 2013
3.944
+0.622
18.74%
jan 1, 2014
3.047
-0.897
-22.74%
jan 1, 2015
6.797
+3.75
123.07%
jan 1, 2016
6.586
-0.211
-3.11%
Ranking of countries by current statistics by years


Comments: