29
/
en
AIzaSyAYiBZKx7MnpbEhh9jyipgxe19OcubqV5w
April 1, 2024
186763
Malawi
MWI
true
2
1
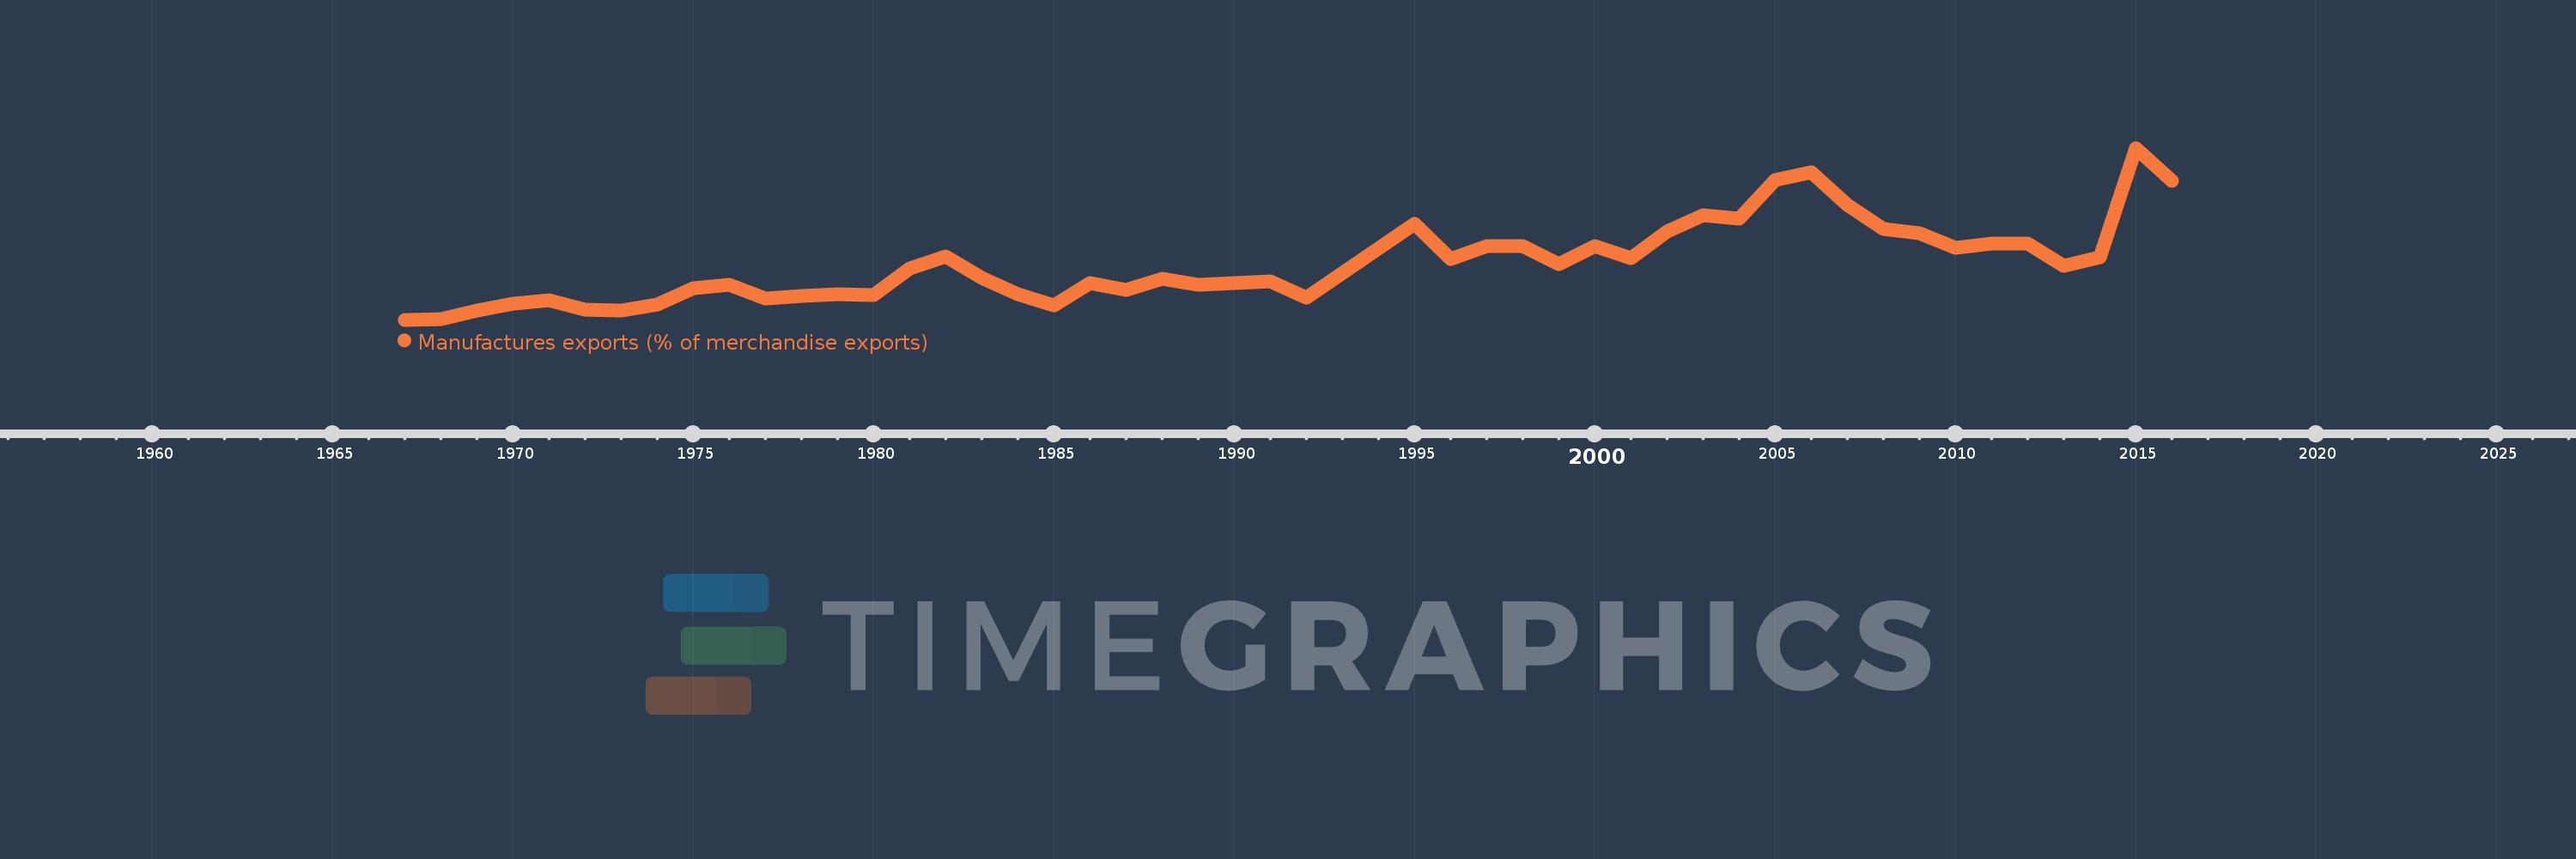
Manufactures exports (% of merchandise exports)
2016,2015,2014,2013,2012,2011,2010,2009,2008,2007,2006,2005,2004,2003,2002,2001,2000,1999,1998,1997,1996,1995,1992,1991,1989,1988,1987,1986,1985,1984,1983,1982,1981,1980,1979,1978,1977,1976,1975,1974,1973,1972,1971,1970,1969,1968,1967
This statistics in other country:
AfghanistanAlbaniaAlgeriaAndorraAngolaAntigua and BarbudaArab WorldArgentinaArmeniaArubaAustraliaAustriaAzerbaijanBahamas, TheBahrainBangladeshBarbadosBelarusBelgiumBelizeBeninBermudaBhutanBoliviaBosnia and HerzegovinaBotswanaBrazilBrunei DarussalamBulgariaBurkina FasoBurundiCabo VerdeCambodiaCameroonCanadaCaribbean small statesCayman IslandsCentral African RepublicCentral Europe and the BalticsChadChileChinaColombiaComorosCongo, Dem. Rep.Congo, Rep.Costa RicaCote d'IvoireCroatiaCubaCyprusCzech RepublicDenmarkDjiboutiDominicaDominican RepublicEarly-demographic dividendEast Asia & PacificEast Asia & Pacific (excluding high income)East Asia & Pacific (IDA & IBRD countries)EcuadorEgypt, Arab Rep.El SalvadorEquatorial GuineaEritreaEstoniaEthiopiaEuro areaEurope & Central AsiaEurope & Central Asia (excluding high income)Europe & Central Asia (IDA & IBRD countries)European UnionFaroe IslandsFijiFinlandFragile and conflict affected situationsFranceFrench PolynesiaGabonGambia, TheGeorgiaGermanyGhanaGreeceGreenlandGrenadaGuatemalaGuineaGuinea-BissauGuyanaHaitiHeavily indebted poor countries (HIPC)High incomeHondurasHong Kong SAR, ChinaHungaryIBRD onlyIcelandIDA & IBRD totalIDA blendIDA onlyIDA totalIndiaIndonesiaIran, Islamic Rep.IraqIrelandIsraelItalyJamaicaJapanJordanKazakhstanKenyaKiribatiKorea, Rep.KuwaitKyrgyz RepublicLao PDRLate-demographic dividendLatin America & Caribbean Latin America & Caribbean (excluding high income)Latin America & the Caribbean (IDA & IBRD countries)LatviaLeast developed countries: UN classificationLebanonLesothoLiberiaLibyaLithuaniaLow & middle incomeLower middle incomeLuxembourgMacao SAR, ChinaMacedonia, FYRMadagascarMalawiMalaysiaMaldivesMaliMaltaMauritaniaMauritiusMexicoMiddle East & North AfricaMiddle East & North Africa (excluding high income)Middle East & North Africa (IDA & IBRD countries)Middle incomeMoldovaMongoliaMoroccoMozambiqueMyanmarNamibiaNepalNetherlandsNew CaledoniaNew ZealandNicaraguaNigerNigeriaNorth AmericaNorwayOECD membersOmanOther small statesPacific island small statesPakistanPalauPanamaPapua New GuineaParaguayPeruPhilippinesPolandPortugalPost-demographic dividendPre-demographic dividendQatarRomaniaRussian FederationRwandaSamoaSao Tome and PrincipeSaudi ArabiaSenegalSerbiaSeychellesSierra LeoneSingaporeSlovak RepublicSloveniaSmall statesSolomon IslandsSomaliaSouth AfricaSouth AsiaSouth Asia (IDA & IBRD)SpainSri LankaSt. Kitts and NevisSt. LuciaSt. Vincent and the GrenadinesSub-Saharan Africa Sub-Saharan Africa (excluding high income)Sub-Saharan Africa (IDA & IBRD countries)SudanSurinameSwazilandSwedenSwitzerlandSyrian Arab RepublicTajikistanTanzaniaThailandTimor-LesteTogoTongaTrinidad and TobagoTunisiaTurkeyTurkmenistanTurks and Caicos IslandsTuvaluUgandaUkraineUnited Arab EmiratesUnited KingdomUnited StatesUpper middle incomeUruguayVanuatuVenezuela, RBVietnamVirgin Islands (U.S.)WorldYemen, Rep.ZambiaZimbabwe Timeline:
This timeline shows a graph from 1967 to 2016 of Malawi. No data until 1966. Number of actual observations by date: 47.
Source name:
World Development Indicators
Source organization:
World Bank staff estimates from the Comtrade database maintained by the United Nations Statistics Division.
Categories, topics:
Private Sector, Trade
Last updated:
apr 23, 2017
Indicators value changes by year
Maximum:
18.725
jan 1, 2015
At the date of observation
Value
Absolute change
Change from previous value
jan 1, 1967
1.168
+1.168
0.0%
jan 1, 1968
1.221
+0.053
4.54%
jan 1, 1969
2.121
+0.9
73.68%
jan 1, 1970
2.852
+0.731
34.45%
jan 1, 1971
3.159
+0.307
10.78%
jan 1, 1972
2.233
-0.926
-29.3%
jan 1, 1973
2.113
-0.12
-5.39%
jan 1, 1974
2.728
+0.615
29.1%
jan 1, 1975
4.382
+1.655
60.66%
jan 1, 1976
4.72
+0.338
7.71%
jan 1, 1977
3.351
-1.37
-29.01%
jan 1, 1978
3.61
+0.259
7.74%
jan 1, 1979
3.794
+0.184
5.1%
jan 1, 1980
3.659
-0.135
-3.57%
jan 1, 1981
6.372
+2.713
74.14%
jan 1, 1982
7.618
+1.246
19.55%
jan 1, 1983
5.402
-2.216
-29.09%
jan 1, 1984
3.778
-1.623
-30.05%
jan 1, 1985
2.677
-1.101
-29.15%
jan 1, 1986
4.897
+2.22
82.93%
jan 1, 1987
4.204
-0.693
-14.15%
jan 1, 1988
5.34
+1.136
27.02%
jan 1, 1989
4.714
-0.625
-11.71%
jan 1, 1991
5.103
+0.388
8.24%
jan 1, 1992
3.391
-1.712
-33.55%
jan 1, 1995
11.007
+7.616
224.62%
jan 1, 1996
7.345
-3.662
-33.27%
jan 1, 1997
8.667
+1.322
18.0%
jan 1, 1998
8.693
+0.026
0.3%
jan 1, 1999
6.87
-1.823
-20.97%
jan 1, 2000
8.672
+1.802
26.22%
jan 1, 2001
7.446
-1.226
-14.13%
jan 1, 2002
10.201
+2.755
37.0%
jan 1, 2003
11.81
+1.609
15.77%
jan 1, 2004
11.517
-0.293
-2.48%
jan 1, 2005
15.443
+3.925
34.08%
jan 1, 2006
16.274
+0.831
5.38%
jan 1, 2007
12.928
-3.346
-20.56%
jan 1, 2008
10.461
-2.467
-19.08%
jan 1, 2009
10.042
-0.419
-4.01%
jan 1, 2010
8.547
-1.495
-14.89%
jan 1, 2011
8.959
+0.411
4.81%
jan 1, 2012
8.958
0.0
0.0%
jan 1, 2013
6.702
-2.256
-25.18%
jan 1, 2014
7.529
+0.826
12.33%
jan 1, 2015
18.725
+11.196
148.71%
jan 1, 2016
15.356
-3.368
-17.99%
Ranking of countries by current statistics by years


Comments: