29
/
en
AIzaSyAYiBZKx7MnpbEhh9jyipgxe19OcubqV5w
April 1, 2024
117125
Cyprus
CYP
true
2
1
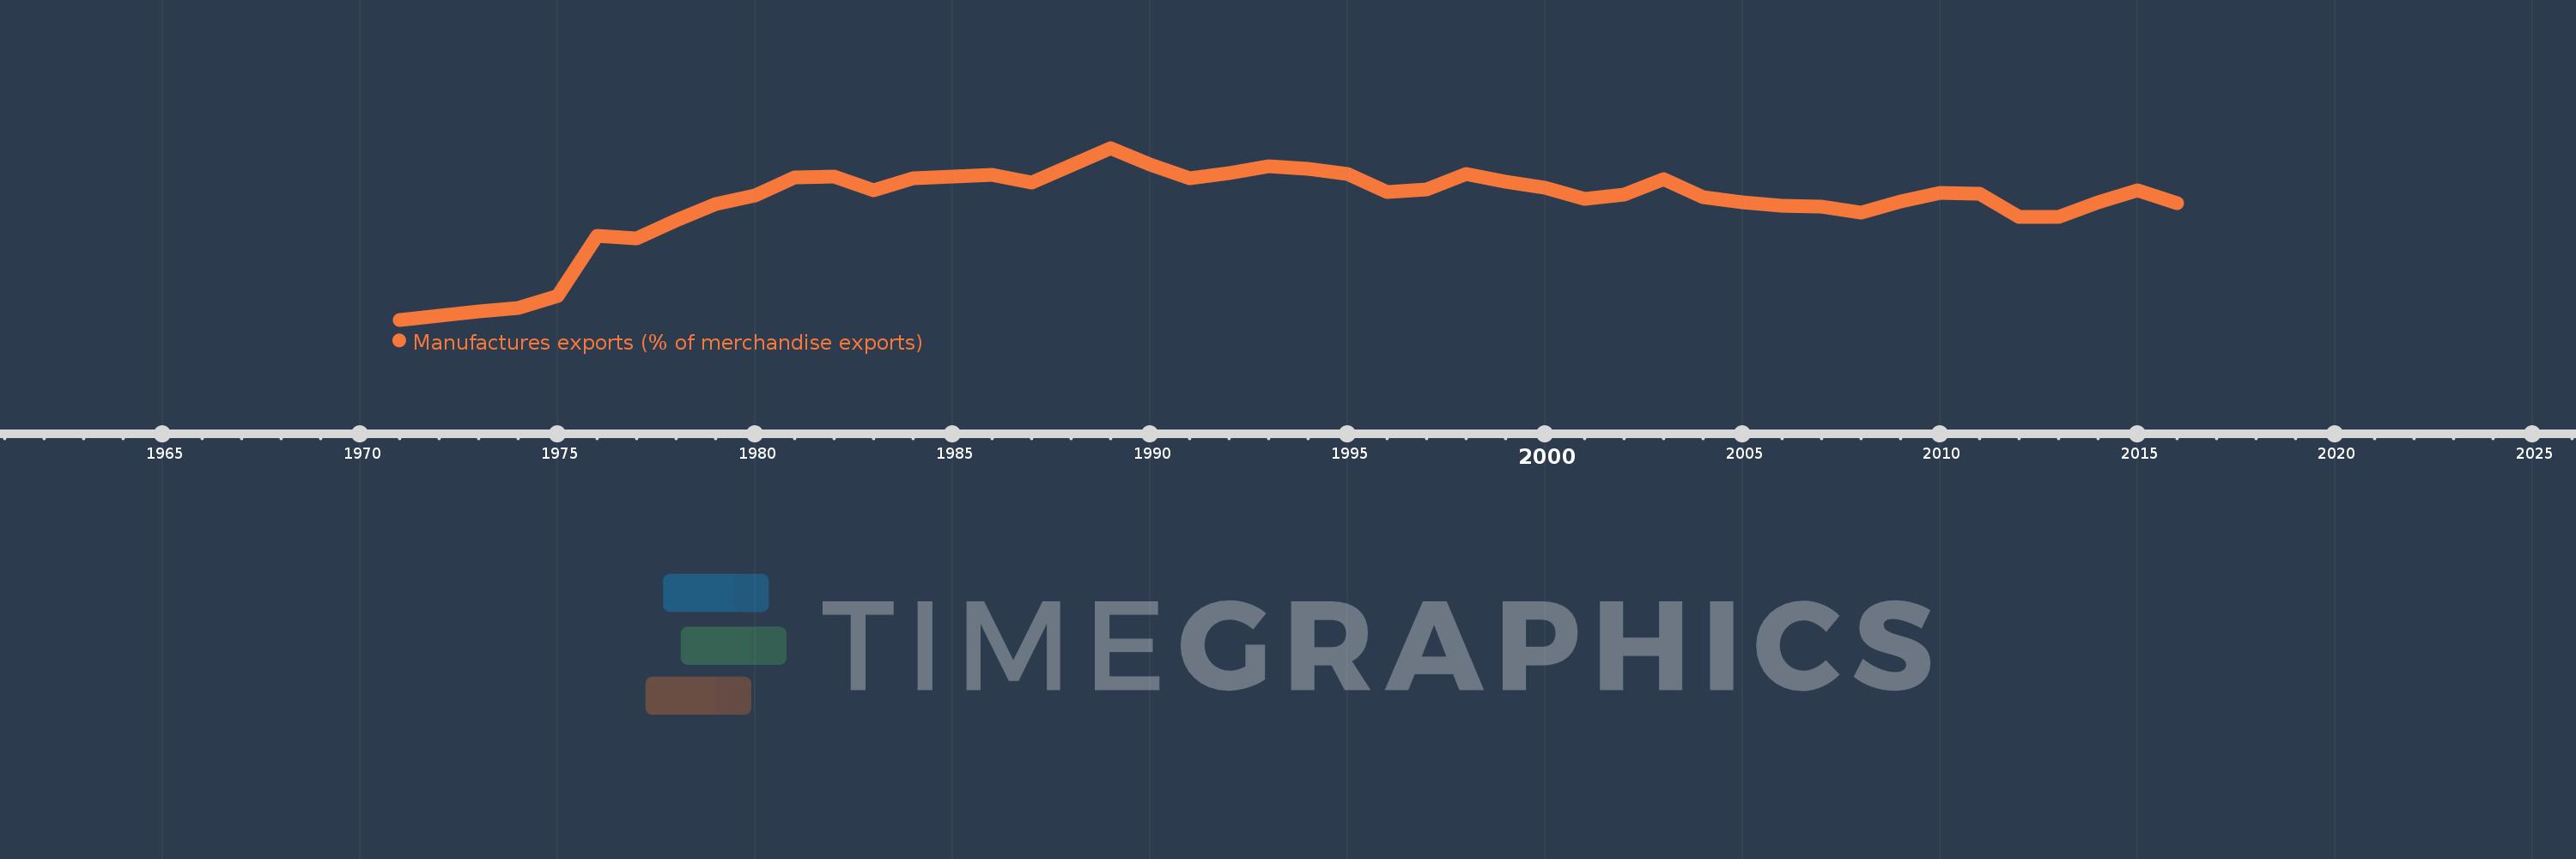
Manufactures exports (% of merchandise exports)
2016,2015,2014,2013,2012,2011,2010,2009,2008,2007,2006,2005,2004,2003,2002,2001,2000,1999,1998,1997,1996,1995,1994,1993,1992,1991,1990,1989,1988,1987,1986,1985,1984,1983,1982,1981,1980,1979,1978,1977,1976,1975,1974,1973,1972,1971
This statistics in other country:
AfghanistanAlbaniaAlgeriaAndorraAngolaAntigua and BarbudaArab WorldArgentinaArmeniaArubaAustraliaAustriaAzerbaijanBahamas, TheBahrainBangladeshBarbadosBelarusBelgiumBelizeBeninBermudaBhutanBoliviaBosnia and HerzegovinaBotswanaBrazilBrunei DarussalamBulgariaBurkina FasoBurundiCabo VerdeCambodiaCameroonCanadaCaribbean small statesCayman IslandsCentral African RepublicCentral Europe and the BalticsChadChileChinaColombiaComorosCongo, Dem. Rep.Congo, Rep.Costa RicaCote d'IvoireCroatiaCubaCyprusCzech RepublicDenmarkDjiboutiDominicaDominican RepublicEarly-demographic dividendEast Asia & PacificEast Asia & Pacific (excluding high income)East Asia & Pacific (IDA & IBRD countries)EcuadorEgypt, Arab Rep.El SalvadorEquatorial GuineaEritreaEstoniaEthiopiaEuro areaEurope & Central AsiaEurope & Central Asia (excluding high income)Europe & Central Asia (IDA & IBRD countries)European UnionFaroe IslandsFijiFinlandFragile and conflict affected situationsFranceFrench PolynesiaGabonGambia, TheGeorgiaGermanyGhanaGreeceGreenlandGrenadaGuatemalaGuineaGuinea-BissauGuyanaHaitiHeavily indebted poor countries (HIPC)High incomeHondurasHong Kong SAR, ChinaHungaryIBRD onlyIcelandIDA & IBRD totalIDA blendIDA onlyIDA totalIndiaIndonesiaIran, Islamic Rep.IraqIrelandIsraelItalyJamaicaJapanJordanKazakhstanKenyaKiribatiKorea, Rep.KuwaitKyrgyz RepublicLao PDRLate-demographic dividendLatin America & Caribbean Latin America & Caribbean (excluding high income)Latin America & the Caribbean (IDA & IBRD countries)LatviaLeast developed countries: UN classificationLebanonLesothoLiberiaLibyaLithuaniaLow & middle incomeLower middle incomeLuxembourgMacao SAR, ChinaMacedonia, FYRMadagascarMalawiMalaysiaMaldivesMaliMaltaMauritaniaMauritiusMexicoMiddle East & North AfricaMiddle East & North Africa (excluding high income)Middle East & North Africa (IDA & IBRD countries)Middle incomeMoldovaMongoliaMoroccoMozambiqueMyanmarNamibiaNepalNetherlandsNew CaledoniaNew ZealandNicaraguaNigerNigeriaNorth AmericaNorwayOECD membersOmanOther small statesPacific island small statesPakistanPalauPanamaPapua New GuineaParaguayPeruPhilippinesPolandPortugalPost-demographic dividendPre-demographic dividendQatarRomaniaRussian FederationRwandaSamoaSao Tome and PrincipeSaudi ArabiaSenegalSerbiaSeychellesSierra LeoneSingaporeSlovak RepublicSloveniaSmall statesSolomon IslandsSomaliaSouth AfricaSouth AsiaSouth Asia (IDA & IBRD)SpainSri LankaSt. Kitts and NevisSt. LuciaSt. Vincent and the GrenadinesSub-Saharan Africa Sub-Saharan Africa (excluding high income)Sub-Saharan Africa (IDA & IBRD countries)SudanSurinameSwazilandSwedenSwitzerlandSyrian Arab RepublicTajikistanTanzaniaThailandTimor-LesteTogoTongaTrinidad and TobagoTunisiaTurkeyTurkmenistanTurks and Caicos IslandsTuvaluUgandaUkraineUnited Arab EmiratesUnited KingdomUnited StatesUpper middle incomeUruguayVanuatuVenezuela, RBVietnamVirgin Islands (U.S.)WorldYemen, Rep.ZambiaZimbabwe Timeline:
This timeline shows a graph from 1971 to 2016 of Cyprus. No data until 1970. Number of actual observations by date: 46.
Source name:
World Development Indicators
Source organization:
World Bank staff estimates from the Comtrade database maintained by the United Nations Statistics Division.
Categories, topics:
Private Sector, Trade
Last updated:
apr 23, 2017
Indicators value changes by year
Minimum:
12.553
jan 1, 1971
Maximum:
63.976
jan 1, 1989
At the date of observation
Value
Absolute change
Change from previous value
jan 1, 1971
12.553
+12.553
0.0%
jan 1, 1972
13.768
+1.215
9.68%
jan 1, 1973
14.969
+1.201
8.72%
jan 1, 1974
16.039
+1.07
7.15%
jan 1, 1975
19.61
+3.572
22.27%
jan 1, 1976
37.643
+18.032
91.95%
jan 1, 1977
36.827
-0.816
-2.17%
jan 1, 1978
42.393
+5.566
15.11%
jan 1, 1979
47.072
+4.68
11.04%
jan 1, 1980
49.708
+2.636
5.6%
jan 1, 1981
55.116
+5.408
10.88%
jan 1, 1982
55.366
+0.25
0.45%
jan 1, 1983
51.394
-3.972
-7.17%
jan 1, 1984
54.941
+3.548
6.9%
jan 1, 1985
55.303
+0.362
0.66%
jan 1, 1986
55.825
+0.522
0.94%
jan 1, 1987
53.585
-2.241
-4.01%
jan 1, 1988
58.758
+5.174
9.66%
jan 1, 1989
63.976
+5.217
8.88%
jan 1, 1990
59.023
-4.953
-7.74%
jan 1, 1991
54.814
-4.209
-7.13%
jan 1, 1992
56.36
+1.547
2.82%
jan 1, 1993
58.493
+2.133
3.78%
jan 1, 1994
57.716
-0.777
-1.33%
jan 1, 1995
56.212
-1.504
-2.61%
jan 1, 1996
50.771
-5.442
-9.68%
jan 1, 1997
51.548
+0.777
1.53%
jan 1, 1998
56.12
+4.572
8.87%
jan 1, 1999
53.772
-2.348
-4.18%
jan 1, 2000
52.17
-1.602
-2.98%
jan 1, 2001
48.704
-3.466
-6.64%
jan 1, 2002
50.099
+1.395
2.86%
jan 1, 2003
54.743
+4.644
9.27%
jan 1, 2004
49.229
-5.514
-10.07%
jan 1, 2005
47.725
-1.504
-3.05%
jan 1, 2006
46.581
-1.144
-2.4%
jan 1, 2007
46.353
-0.228
-0.49%
jan 1, 2008
44.561
-1.792
-3.87%
jan 1, 2009
48.041
+3.48
7.81%
jan 1, 2010
50.414
+2.373
4.94%
jan 1, 2011
50.155
-0.259
-0.51%
jan 1, 2012
43.347
-6.808
-13.57%
jan 1, 2013
43.404
+0.057
0.13%
jan 1, 2014
47.703
+4.299
9.91%
jan 1, 2015
51.357
+3.654
7.66%
jan 1, 2016
47.438
-3.919
-7.63%
Ranking of countries by current statistics by years


Comments: