29
/
en
AIzaSyAYiBZKx7MnpbEhh9jyipgxe19OcubqV5w
April 1, 2024
281246
Venezuela, RB
VEN
true
2
1
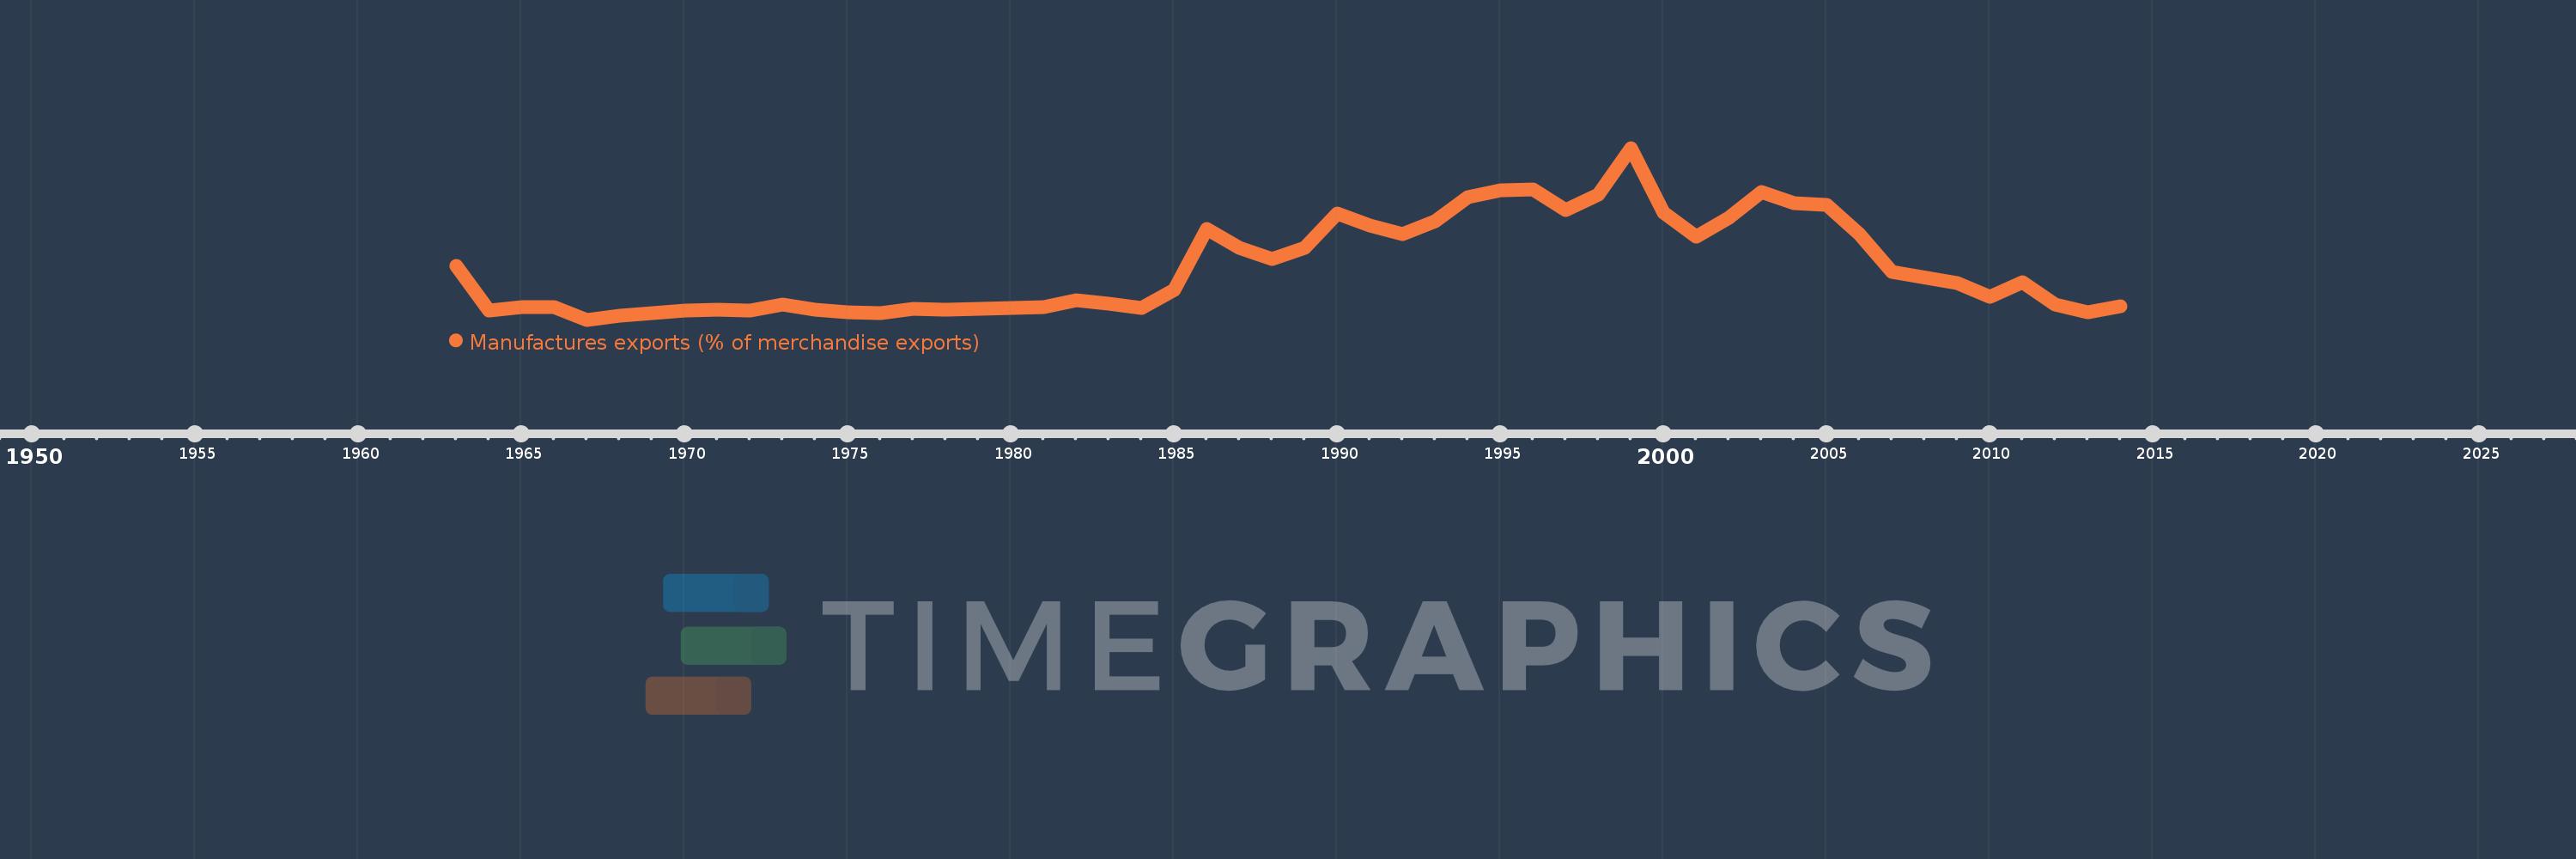
Manufactures exports (% of merchandise exports)
2014,2013,2012,2011,2010,2009,2007,2006,2005,2004,2003,2002,2001,2000,1999,1998,1997,1996,1995,1994,1993,1992,1991,1990,1989,1988,1987,1986,1985,1984,1983,1982,1981,1980,1979,1978,1977,1976,1975,1974,1973,1972,1971,1970,1969,1968,1967,1966,1965,1964,1963
This statistics in other country:
AfghanistanAlbaniaAlgeriaAndorraAngolaAntigua and BarbudaArab WorldArgentinaArmeniaArubaAustraliaAustriaAzerbaijanBahamas, TheBahrainBangladeshBarbadosBelarusBelgiumBelizeBeninBermudaBhutanBoliviaBosnia and HerzegovinaBotswanaBrazilBrunei DarussalamBulgariaBurkina FasoBurundiCabo VerdeCambodiaCameroonCanadaCaribbean small statesCayman IslandsCentral African RepublicCentral Europe and the BalticsChadChileChinaColombiaComorosCongo, Dem. Rep.Congo, Rep.Costa RicaCote d'IvoireCroatiaCubaCyprusCzech RepublicDenmarkDjiboutiDominicaDominican RepublicEarly-demographic dividendEast Asia & PacificEast Asia & Pacific (excluding high income)East Asia & Pacific (IDA & IBRD countries)EcuadorEgypt, Arab Rep.El SalvadorEquatorial GuineaEritreaEstoniaEthiopiaEuro areaEurope & Central AsiaEurope & Central Asia (excluding high income)Europe & Central Asia (IDA & IBRD countries)European UnionFaroe IslandsFijiFinlandFragile and conflict affected situationsFranceFrench PolynesiaGabonGambia, TheGeorgiaGermanyGhanaGreeceGreenlandGrenadaGuatemalaGuineaGuinea-BissauGuyanaHaitiHeavily indebted poor countries (HIPC)High incomeHondurasHong Kong SAR, ChinaHungaryIBRD onlyIcelandIDA & IBRD totalIDA blendIDA onlyIDA totalIndiaIndonesiaIran, Islamic Rep.IraqIrelandIsraelItalyJamaicaJapanJordanKazakhstanKenyaKiribatiKorea, Rep.KuwaitKyrgyz RepublicLao PDRLate-demographic dividendLatin America & Caribbean Latin America & Caribbean (excluding high income)Latin America & the Caribbean (IDA & IBRD countries)LatviaLeast developed countries: UN classificationLebanonLesothoLiberiaLibyaLithuaniaLow & middle incomeLower middle incomeLuxembourgMacao SAR, ChinaMacedonia, FYRMadagascarMalawiMalaysiaMaldivesMaliMaltaMauritaniaMauritiusMexicoMiddle East & North AfricaMiddle East & North Africa (excluding high income)Middle East & North Africa (IDA & IBRD countries)Middle incomeMoldovaMongoliaMoroccoMozambiqueMyanmarNamibiaNepalNetherlandsNew CaledoniaNew ZealandNicaraguaNigerNigeriaNorth AmericaNorwayOECD membersOmanOther small statesPacific island small statesPakistanPalauPanamaPapua New GuineaParaguayPeruPhilippinesPolandPortugalPost-demographic dividendPre-demographic dividendQatarRomaniaRussian FederationRwandaSamoaSao Tome and PrincipeSaudi ArabiaSenegalSerbiaSeychellesSierra LeoneSingaporeSlovak RepublicSloveniaSmall statesSolomon IslandsSomaliaSouth AfricaSouth AsiaSouth Asia (IDA & IBRD)SpainSri LankaSt. Kitts and NevisSt. LuciaSt. Vincent and the GrenadinesSub-Saharan Africa Sub-Saharan Africa (excluding high income)Sub-Saharan Africa (IDA & IBRD countries)SudanSurinameSwazilandSwedenSwitzerlandSyrian Arab RepublicTajikistanTanzaniaThailandTimor-LesteTogoTongaTrinidad and TobagoTunisiaTurkeyTurkmenistanTurks and Caicos IslandsTuvaluUgandaUkraineUnited Arab EmiratesUnited KingdomUnited StatesUpper middle incomeUruguayVanuatuVenezuela, RBVietnamVirgin Islands (U.S.)WorldYemen, Rep.ZambiaZimbabwe Timeline:
This timeline shows a graph from 1963 to 2014 of Venezuela, RB. No data until 1962. Number of actual observations by date: 51.
Source name:
World Development Indicators
Source organization:
World Bank staff estimates from the Comtrade database maintained by the United Nations Statistics Division.
Categories, topics:
Private Sector, Trade
Last updated:
apr 23, 2017
Indicators value changes by year
Maximum:
18.543
jan 1, 1999
At the date of observation
Value
Absolute change
Change from previous value
jan 1, 1963
6.059
+6.059
0.0%
jan 1, 1964
1.298
-4.76
-78.57%
jan 1, 1965
1.65
+0.352
27.12%
jan 1, 1966
1.739
+0.089
5.38%
jan 1, 1967
0.358
-1.381
-79.43%
jan 1, 1968
0.773
+0.415
116.03%
jan 1, 1969
1.054
+0.281
36.33%
jan 1, 1970
1.325
+0.272
25.8%
jan 1, 1971
1.387
+0.062
4.65%
jan 1, 1972
1.338
-0.048
-3.49%
jan 1, 1973
1.928
+0.589
44.01%
jan 1, 1974
1.386
-0.541
-28.08%
jan 1, 1975
1.183
-0.204
-14.68%
jan 1, 1976
1.033
-0.149
-12.63%
jan 1, 1977
1.505
+0.472
45.63%
jan 1, 1978
1.442
-0.063
-4.18%
jan 1, 1979
1.55
+0.108
7.47%
jan 1, 1980
1.639
+0.089
5.77%
jan 1, 1981
1.709
+0.069
4.24%
jan 1, 1982
2.378
+0.67
39.2%
jan 1, 1983
2.063
-0.315
-13.26%
jan 1, 1984
1.614
-0.449
-21.77%
jan 1, 1985
3.529
+1.915
118.67%
jan 1, 1986
9.956
+6.427
182.14%
jan 1, 1987
7.951
-2.005
-20.13%
jan 1, 1988
6.741
-1.211
-15.23%
jan 1, 1989
8.003
+1.263
18.73%
jan 1, 1990
11.64
+3.637
45.44%
jan 1, 1991
10.372
-1.268
-10.89%
jan 1, 1992
9.395
-0.977
-9.42%
jan 1, 1993
10.814
+1.419
15.1%
jan 1, 1994
13.367
+2.553
23.61%
jan 1, 1995
14.031
+0.664
4.96%
jan 1, 1996
14.163
+0.132
0.94%
jan 1, 1997
11.981
-2.182
-15.41%
jan 1, 1998
13.635
+1.654
13.81%
jan 1, 1999
18.543
+4.908
36.0%
jan 1, 2000
11.667
-6.876
-37.08%
jan 1, 2001
9.128
-2.54
-21.77%
jan 1, 2002
11.187
+2.059
22.56%
jan 1, 2003
13.834
+2.647
23.66%
jan 1, 2004
12.71
-1.124
-8.12%
jan 1, 2005
12.505
-0.205
-1.61%
jan 1, 2006
9.418
-3.088
-24.69%
jan 1, 2007
5.404
-4.014
-42.62%
jan 1, 2009
4.268
-1.136
-21.02%
jan 1, 2010
2.799
-1.469
-34.42%
jan 1, 2011
4.295
+1.495
53.42%
jan 1, 2012
1.981
-2.314
-53.88%
jan 1, 2013
1.19
-0.79
-39.91%
jan 1, 2014
1.82
+0.63
52.89%
Ranking of countries by current statistics by years


Comments: