29
/
en
AIzaSyAYiBZKx7MnpbEhh9jyipgxe19OcubqV5w
April 1, 2024
37529
IDA & IBRD total
IBT
false
2
1
Manufactures exports (% of merchandise exports)
2016,2015,2014,2013,2012,2011,2010,2009,2008,2007,2006,2005,2004,2003,2002,2001,2000,1999,1998,1997,1996,1995,1994,1993,1992,1991,1990,1989,1988,1987,1986,1985
This statistics in other country:
AfghanistanAlbaniaAlgeriaAndorraAngolaAntigua and BarbudaArab WorldArgentinaArmeniaArubaAustraliaAustriaAzerbaijanBahamas, TheBahrainBangladeshBarbadosBelarusBelgiumBelizeBeninBermudaBhutanBoliviaBosnia and HerzegovinaBotswanaBrazilBrunei DarussalamBulgariaBurkina FasoBurundiCabo VerdeCambodiaCameroonCanadaCaribbean small statesCayman IslandsCentral African RepublicCentral Europe and the BalticsChadChileChinaColombiaComorosCongo, Dem. Rep.Congo, Rep.Costa RicaCote d'IvoireCroatiaCubaCyprusCzech RepublicDenmarkDjiboutiDominicaDominican RepublicEarly-demographic dividendEast Asia & PacificEast Asia & Pacific (excluding high income)East Asia & Pacific (IDA & IBRD countries)EcuadorEgypt, Arab Rep.El SalvadorEquatorial GuineaEritreaEstoniaEthiopiaEuro areaEurope & Central AsiaEurope & Central Asia (excluding high income)Europe & Central Asia (IDA & IBRD countries)European UnionFaroe IslandsFijiFinlandFragile and conflict affected situationsFranceFrench PolynesiaGabonGambia, TheGeorgiaGermanyGhanaGreeceGreenlandGrenadaGuatemalaGuineaGuinea-BissauGuyanaHaitiHeavily indebted poor countries (HIPC)High incomeHondurasHong Kong SAR, ChinaHungaryIBRD onlyIcelandIDA & IBRD totalIDA blendIDA onlyIDA totalIndiaIndonesiaIran, Islamic Rep.IraqIrelandIsraelItalyJamaicaJapanJordanKazakhstanKenyaKiribatiKorea, Rep.KuwaitKyrgyz RepublicLao PDRLate-demographic dividendLatin America & Caribbean Latin America & Caribbean (excluding high income)Latin America & the Caribbean (IDA & IBRD countries)LatviaLeast developed countries: UN classificationLebanonLesothoLiberiaLibyaLithuaniaLow & middle incomeLower middle incomeLuxembourgMacao SAR, ChinaMacedonia, FYRMadagascarMalawiMalaysiaMaldivesMaliMaltaMauritaniaMauritiusMexicoMiddle East & North AfricaMiddle East & North Africa (excluding high income)Middle East & North Africa (IDA & IBRD countries)Middle incomeMoldovaMongoliaMoroccoMozambiqueMyanmarNamibiaNepalNetherlandsNew CaledoniaNew ZealandNicaraguaNigerNigeriaNorth AmericaNorwayOECD membersOmanOther small statesPacific island small statesPakistanPalauPanamaPapua New GuineaParaguayPeruPhilippinesPolandPortugalPost-demographic dividendPre-demographic dividendQatarRomaniaRussian FederationRwandaSamoaSao Tome and PrincipeSaudi ArabiaSenegalSerbiaSeychellesSierra LeoneSingaporeSlovak RepublicSloveniaSmall statesSolomon IslandsSomaliaSouth AfricaSouth AsiaSouth Asia (IDA & IBRD)SpainSri LankaSt. Kitts and NevisSt. LuciaSt. Vincent and the GrenadinesSub-Saharan Africa Sub-Saharan Africa (excluding high income)Sub-Saharan Africa (IDA & IBRD countries)SudanSurinameSwazilandSwedenSwitzerlandSyrian Arab RepublicTajikistanTanzaniaThailandTimor-LesteTogoTongaTrinidad and TobagoTunisiaTurkeyTurkmenistanTurks and Caicos IslandsTuvaluUgandaUkraineUnited Arab EmiratesUnited KingdomUnited StatesUpper middle incomeUruguayVanuatuVenezuela, RBVietnamVirgin Islands (U.S.)WorldYemen, Rep.ZambiaZimbabwe Timeline:
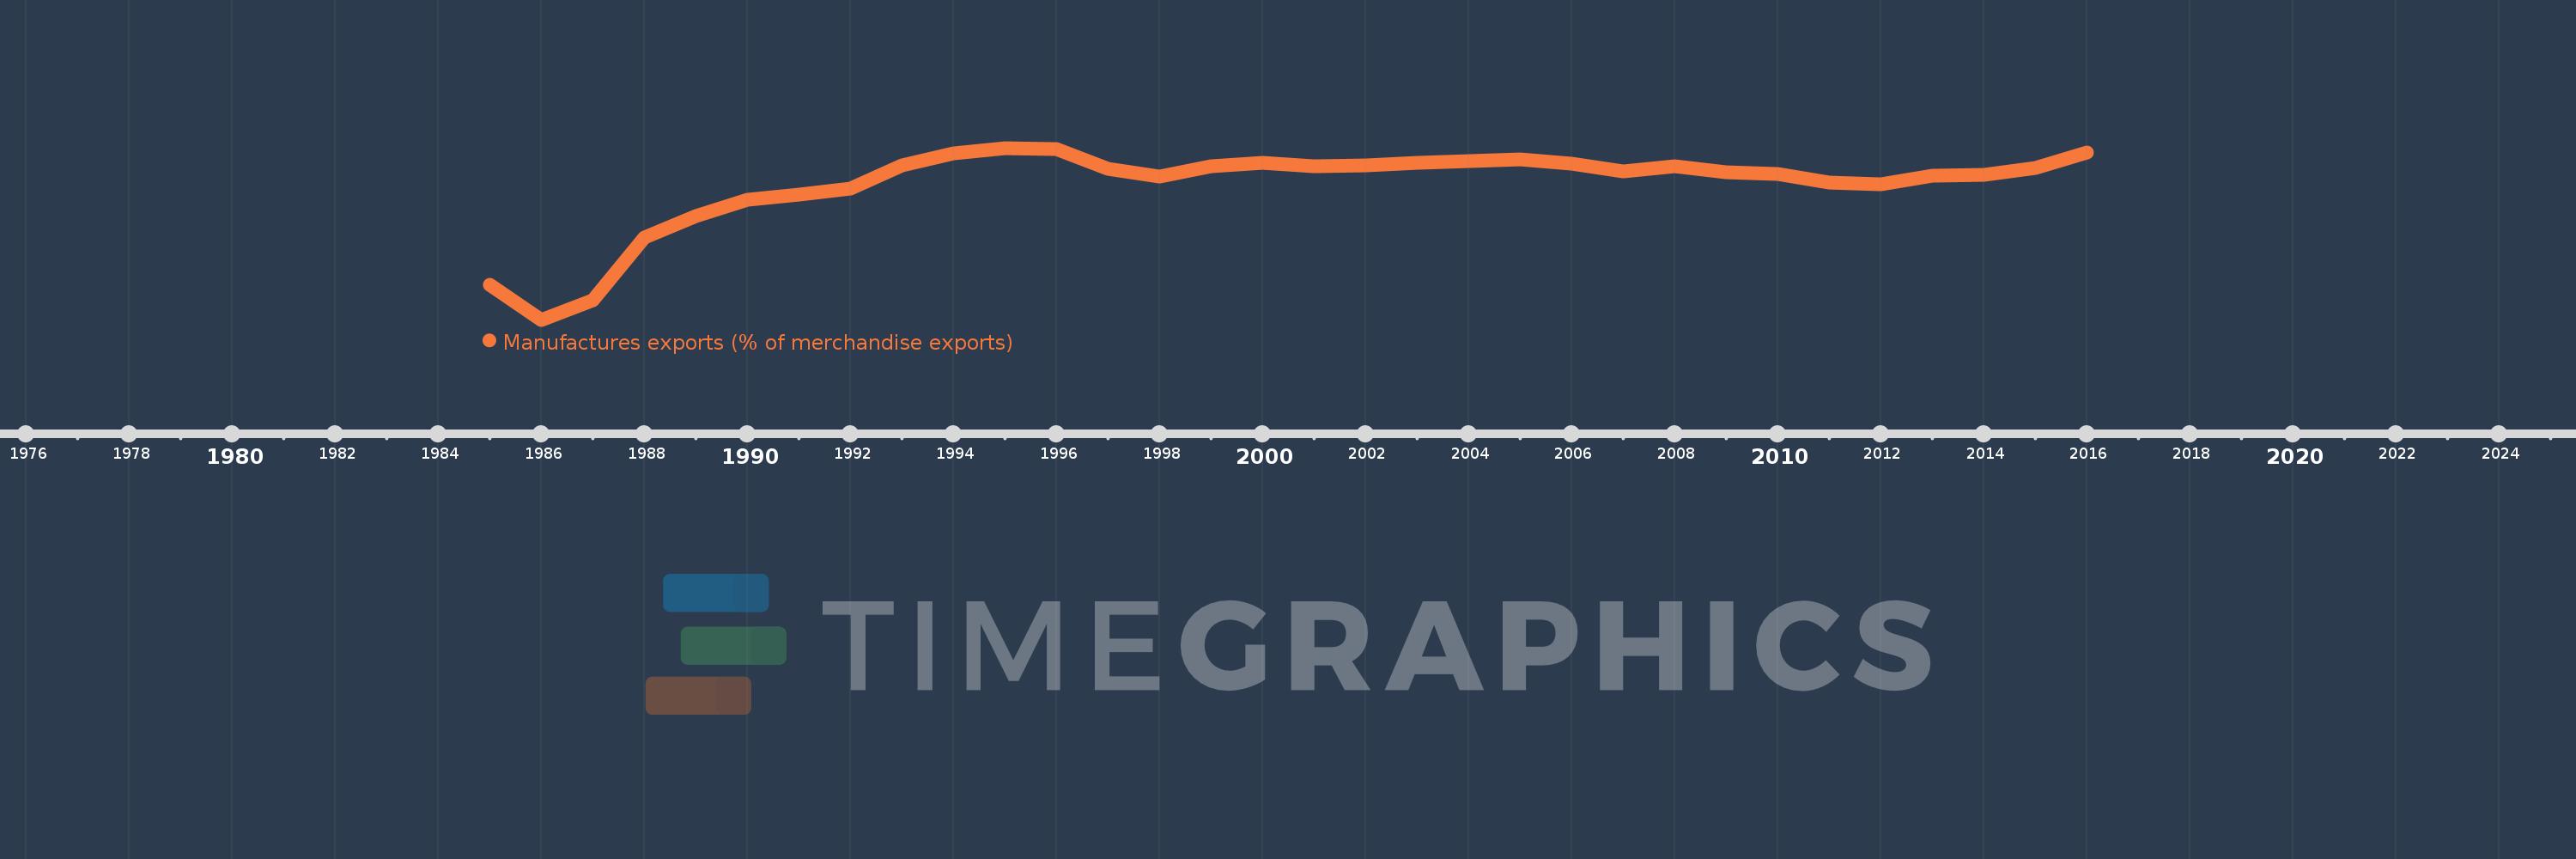
This timeline shows a graph from 1985 to 2016 of IDA & IBRD total. No data until 1984. Number of actual observations by date: 32.
Source name:
World Development Indicators
Source organization:
World Bank staff estimates from the Comtrade database maintained by the United Nations Statistics Division.
Categories, topics:
Private Sector, Trade
Last updated:
apr 23, 2017
Indicators value changes by year
Minimum:
28.052
jan 1, 1986
Maximum:
67.216
jan 1, 1995
At the date of observation
Value
Absolute change
Change from previous value
jan 1, 1985
36.093
+36.093
0.0%
jan 1, 1986
28.052
-8.042
-22.28%
jan 1, 1987
32.586
+4.534
16.16%
jan 1, 1988
46.783
+14.197
43.57%
jan 1, 1989
51.759
+4.976
10.64%
jan 1, 1990
55.327
+3.568
6.89%
jan 1, 1991
56.548
+1.222
2.21%
jan 1, 1992
58.017
+1.469
2.6%
jan 1, 1993
63.218
+5.201
8.96%
jan 1, 1994
65.954
+2.735
4.33%
jan 1, 1995
67.216
+1.263
1.91%
jan 1, 1996
67.056
-0.16
-0.24%
jan 1, 1997
62.445
-4.611
-6.88%
jan 1, 1998
60.683
-1.762
-2.82%
jan 1, 1999
63.08
+2.397
3.95%
jan 1, 2000
63.885
+0.805
1.28%
jan 1, 2001
63.005
-0.88
-1.38%
jan 1, 2002
63.2
+0.195
0.31%
jan 1, 2003
63.873
+0.674
1.07%
jan 1, 2004
64.245
+0.372
0.58%
jan 1, 2005
64.55
+0.304
0.47%
jan 1, 2006
63.58
-0.969
-1.5%
jan 1, 2007
61.823
-1.757
-2.76%
jan 1, 2008
62.971
+1.148
1.86%
jan 1, 2009
61.598
-1.373
-2.18%
jan 1, 2010
61.19
-0.408
-0.66%
jan 1, 2011
59.402
-1.789
-2.92%
jan 1, 2012
58.932
-0.47
-0.79%
jan 1, 2013
60.909
+1.978
3.36%
jan 1, 2014
61.127
+0.217
0.36%
jan 1, 2015
62.73
+1.604
2.62%
jan 1, 2016
66.214
+3.484
5.55%
Ranking of countries by current statistics by years


Comments: