29
/
en
AIzaSyAYiBZKx7MnpbEhh9jyipgxe19OcubqV5w
April 1, 2024
209528
New Zealand
NZL
true
2
1
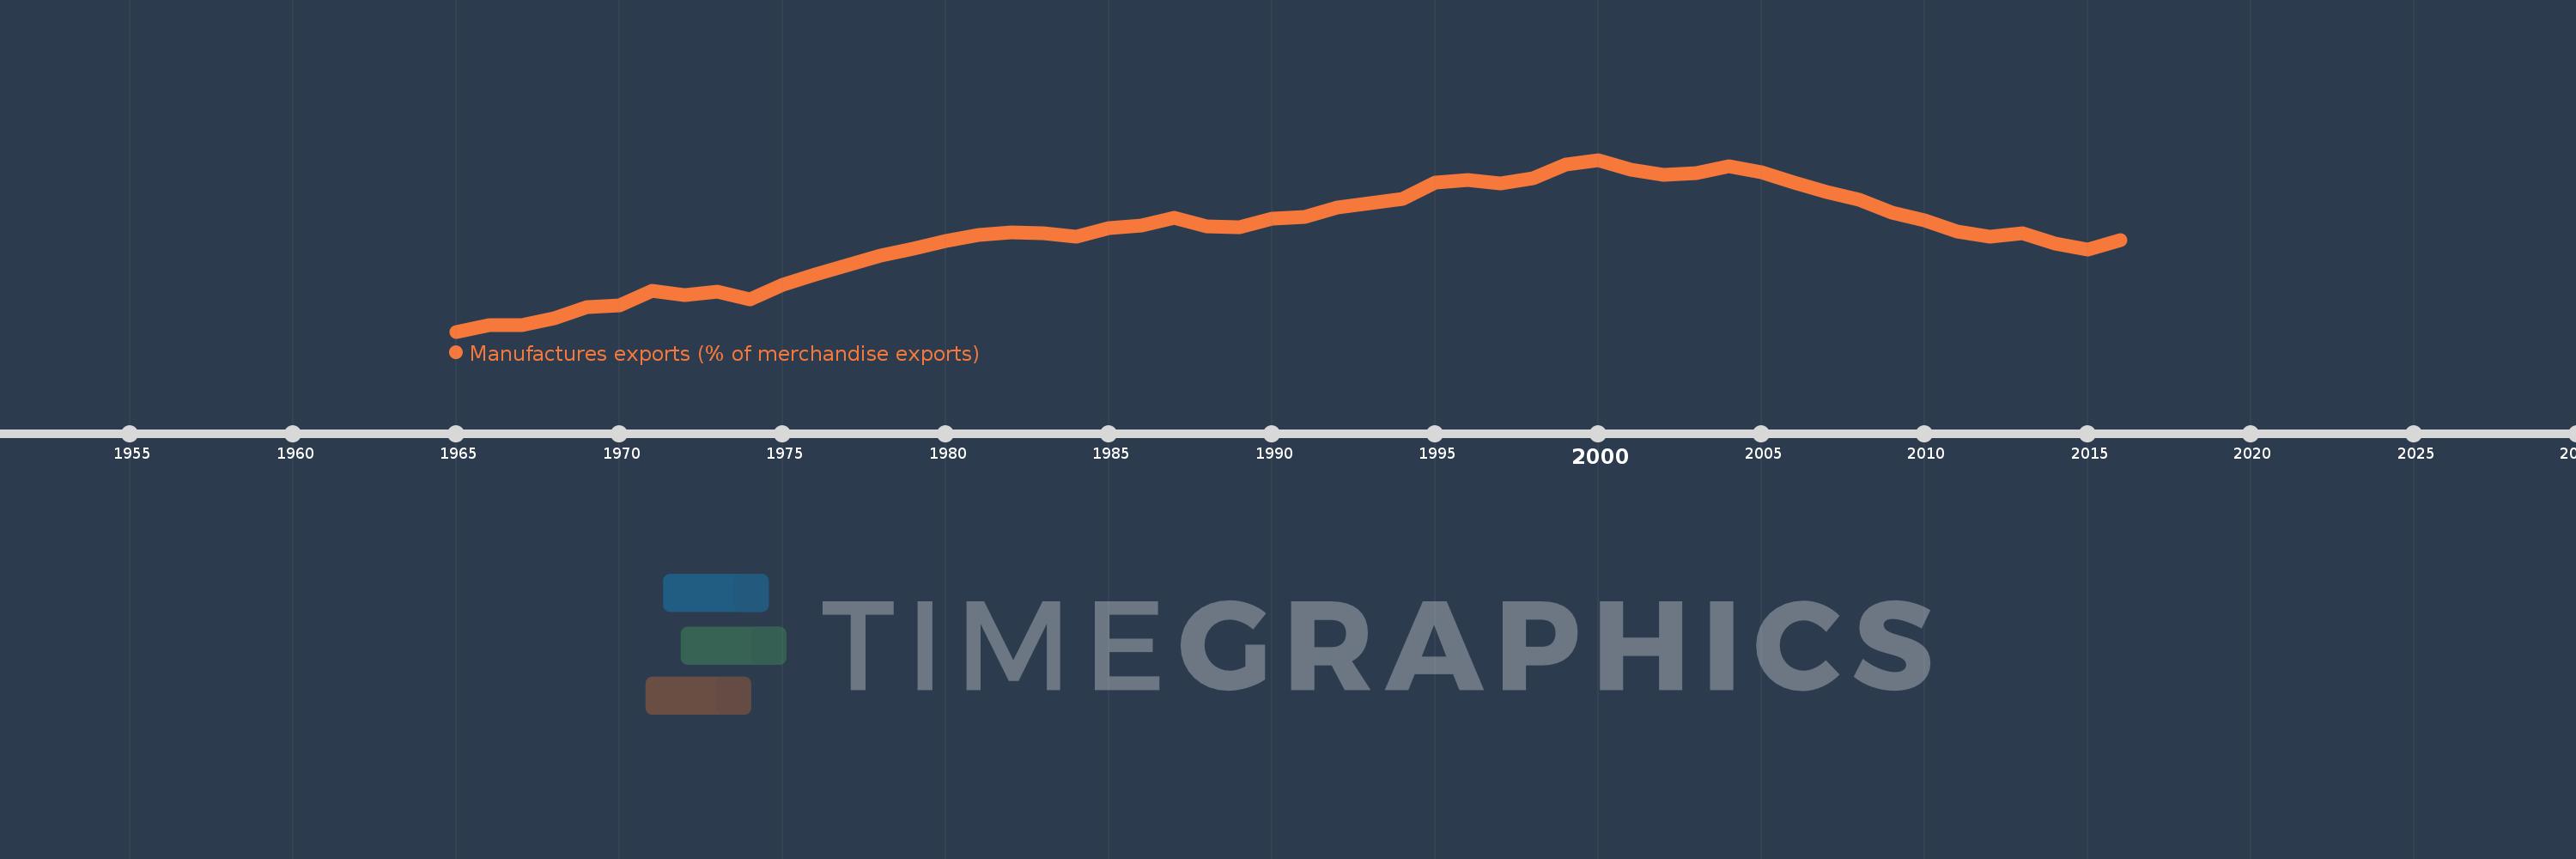
Manufactures exports (% of merchandise exports)
2016,2015,2014,2013,2012,2011,2010,2009,2008,2007,2006,2005,2004,2003,2002,2001,2000,1999,1998,1997,1996,1995,1994,1993,1992,1991,1990,1989,1988,1987,1986,1985,1984,1983,1982,1981,1980,1979,1978,1977,1976,1975,1974,1973,1972,1971,1970,1969,1968,1967,1966,1965
This statistics in other country:
AfghanistanAlbaniaAlgeriaAndorraAngolaAntigua and BarbudaArab WorldArgentinaArmeniaArubaAustraliaAustriaAzerbaijanBahamas, TheBahrainBangladeshBarbadosBelarusBelgiumBelizeBeninBermudaBhutanBoliviaBosnia and HerzegovinaBotswanaBrazilBrunei DarussalamBulgariaBurkina FasoBurundiCabo VerdeCambodiaCameroonCanadaCaribbean small statesCayman IslandsCentral African RepublicCentral Europe and the BalticsChadChileChinaColombiaComorosCongo, Dem. Rep.Congo, Rep.Costa RicaCote d'IvoireCroatiaCubaCyprusCzech RepublicDenmarkDjiboutiDominicaDominican RepublicEarly-demographic dividendEast Asia & PacificEast Asia & Pacific (excluding high income)East Asia & Pacific (IDA & IBRD countries)EcuadorEgypt, Arab Rep.El SalvadorEquatorial GuineaEritreaEstoniaEthiopiaEuro areaEurope & Central AsiaEurope & Central Asia (excluding high income)Europe & Central Asia (IDA & IBRD countries)European UnionFaroe IslandsFijiFinlandFragile and conflict affected situationsFranceFrench PolynesiaGabonGambia, TheGeorgiaGermanyGhanaGreeceGreenlandGrenadaGuatemalaGuineaGuinea-BissauGuyanaHaitiHeavily indebted poor countries (HIPC)High incomeHondurasHong Kong SAR, ChinaHungaryIBRD onlyIcelandIDA & IBRD totalIDA blendIDA onlyIDA totalIndiaIndonesiaIran, Islamic Rep.IraqIrelandIsraelItalyJamaicaJapanJordanKazakhstanKenyaKiribatiKorea, Rep.KuwaitKyrgyz RepublicLao PDRLate-demographic dividendLatin America & Caribbean Latin America & Caribbean (excluding high income)Latin America & the Caribbean (IDA & IBRD countries)LatviaLeast developed countries: UN classificationLebanonLesothoLiberiaLibyaLithuaniaLow & middle incomeLower middle incomeLuxembourgMacao SAR, ChinaMacedonia, FYRMadagascarMalawiMalaysiaMaldivesMaliMaltaMauritaniaMauritiusMexicoMiddle East & North AfricaMiddle East & North Africa (excluding high income)Middle East & North Africa (IDA & IBRD countries)Middle incomeMoldovaMongoliaMoroccoMozambiqueMyanmarNamibiaNepalNetherlandsNew CaledoniaNew ZealandNicaraguaNigerNigeriaNorth AmericaNorwayOECD membersOmanOther small statesPacific island small statesPakistanPalauPanamaPapua New GuineaParaguayPeruPhilippinesPolandPortugalPost-demographic dividendPre-demographic dividendQatarRomaniaRussian FederationRwandaSamoaSao Tome and PrincipeSaudi ArabiaSenegalSerbiaSeychellesSierra LeoneSingaporeSlovak RepublicSloveniaSmall statesSolomon IslandsSomaliaSouth AfricaSouth AsiaSouth Asia (IDA & IBRD)SpainSri LankaSt. Kitts and NevisSt. LuciaSt. Vincent and the GrenadinesSub-Saharan Africa Sub-Saharan Africa (excluding high income)Sub-Saharan Africa (IDA & IBRD countries)SudanSurinameSwazilandSwedenSwitzerlandSyrian Arab RepublicTajikistanTanzaniaThailandTimor-LesteTogoTongaTrinidad and TobagoTunisiaTurkeyTurkmenistanTurks and Caicos IslandsTuvaluUgandaUkraineUnited Arab EmiratesUnited KingdomUnited StatesUpper middle incomeUruguayVanuatuVenezuela, RBVietnamVirgin Islands (U.S.)WorldYemen, Rep.ZambiaZimbabwe Timeline:
This timeline shows a graph from 1965 to 2016 of New Zealand. No data until 1964. Number of actual observations by date: 52.
Source name:
World Development Indicators
Source organization:
World Bank staff estimates from the Comtrade database maintained by the United Nations Statistics Division.
Categories, topics:
Private Sector, Trade
Last updated:
apr 23, 2017
Indicators value changes by year
Maximum:
32.503
jan 1, 2000
At the date of observation
Value
Absolute change
Change from previous value
jan 1, 1965
4.366
+4.366
0.0%
jan 1, 1966
5.395
+1.03
23.58%
jan 1, 1967
5.434
+0.038
0.71%
jan 1, 1968
6.564
+1.131
20.81%
jan 1, 1969
8.312
+1.748
26.63%
jan 1, 1970
8.61
+0.298
3.59%
jan 1, 1971
10.991
+2.38
27.64%
jan 1, 1972
10.405
-0.586
-5.33%
jan 1, 1973
10.973
+0.568
5.46%
jan 1, 1974
9.683
-1.29
-11.76%
jan 1, 1975
11.975
+2.292
23.67%
jan 1, 1976
13.753
+1.778
14.84%
jan 1, 1977
15.274
+1.521
11.06%
jan 1, 1978
16.86
+1.586
10.38%
jan 1, 1979
17.887
+1.027
6.09%
jan 1, 1980
19.147
+1.26
7.04%
jan 1, 1981
20.17
+1.023
5.34%
jan 1, 1982
20.557
+0.387
1.92%
jan 1, 1983
20.5
-0.057
-0.28%
jan 1, 1984
19.86
-0.64
-3.12%
jan 1, 1985
21.37
+1.51
7.6%
jan 1, 1986
21.773
+0.403
1.89%
jan 1, 1987
23.052
+1.278
5.87%
jan 1, 1988
21.594
-1.457
-6.32%
jan 1, 1989
21.397
-0.197
-0.91%
jan 1, 1990
22.802
+1.404
6.56%
jan 1, 1991
23.091
+0.289
1.27%
jan 1, 1992
24.681
+1.59
6.89%
jan 1, 1993
25.397
+0.716
2.9%
jan 1, 1994
26.042
+0.645
2.54%
jan 1, 1995
28.835
+2.792
10.72%
jan 1, 1996
29.202
+0.367
1.27%
jan 1, 1997
28.588
-0.614
-2.1%
jan 1, 1998
29.539
+0.951
3.33%
jan 1, 1999
31.742
+2.203
7.46%
jan 1, 2000
32.503
+0.761
2.4%
jan 1, 2001
30.825
-1.678
-5.16%
jan 1, 2002
30.027
-0.798
-2.59%
jan 1, 2003
30.342
+0.316
1.05%
jan 1, 2004
31.49
+1.148
3.78%
jan 1, 2005
30.515
-0.975
-3.1%
jan 1, 2006
28.725
-1.79
-5.87%
jan 1, 2007
27.235
-1.49
-5.19%
jan 1, 2008
25.946
-1.29
-4.73%
jan 1, 2009
23.835
-2.111
-8.14%
jan 1, 2010
22.639
-1.196
-5.02%
jan 1, 2011
20.776
-1.863
-8.23%
jan 1, 2012
19.861
-0.915
-4.41%
jan 1, 2013
20.442
+0.582
2.93%
jan 1, 2014
18.759
-1.683
-8.23%
jan 1, 2015
17.781
-0.979
-5.22%
jan 1, 2016
19.332
+1.552
8.73%
Ranking of countries by current statistics by years


Comments: