29
/
en
AIzaSyAYiBZKx7MnpbEhh9jyipgxe19OcubqV5w
April 1, 2024
238458
Seychelles
SYC
true
2
1
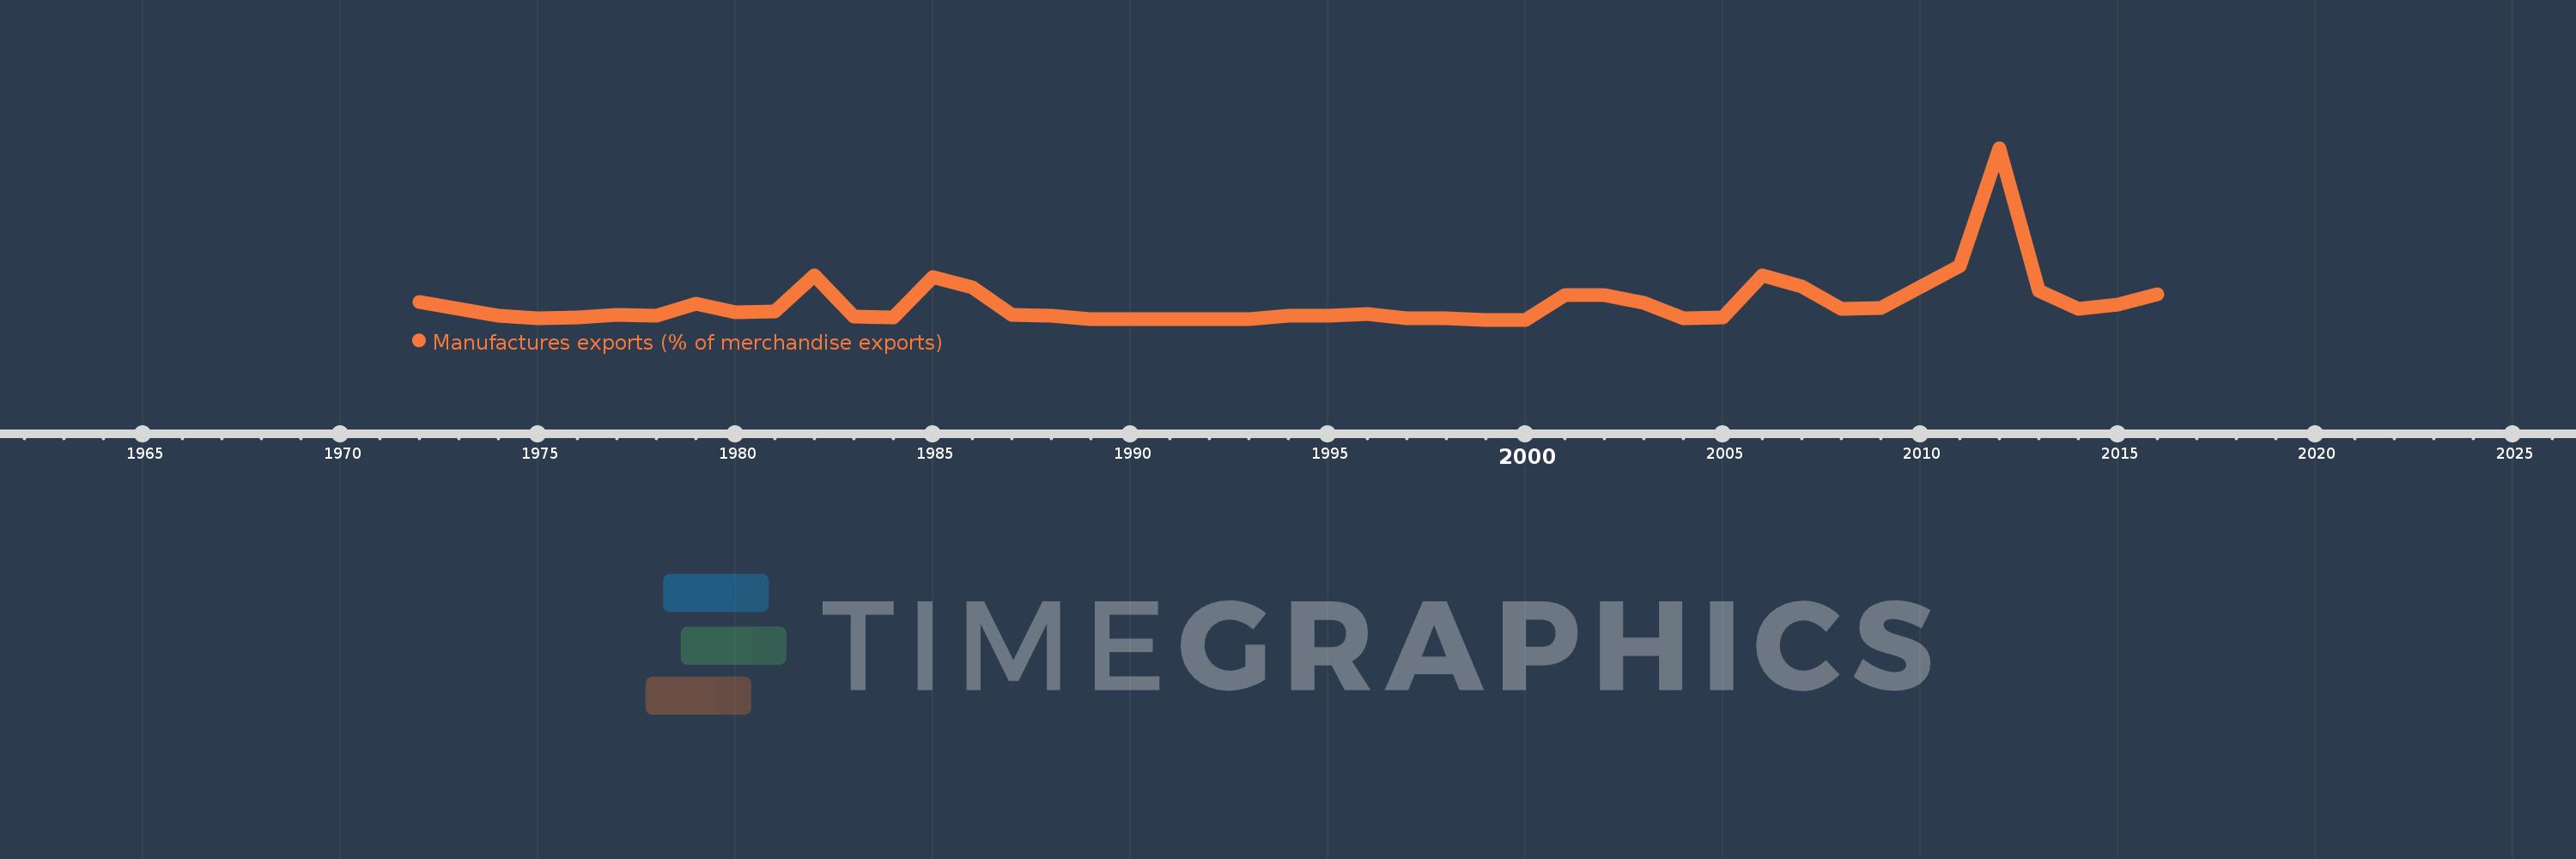
Manufactures exports (% of merchandise exports)
2016,2015,2014,2013,2012,2011,2009,2008,2007,2006,2005,2004,2003,2002,2001,2000,1999,1998,1997,1996,1995,1994,1993,1992,1991,1990,1989,1988,1987,1986,1985,1984,1983,1982,1981,1980,1979,1978,1977,1976,1975,1974,1973,1972
This statistics in other country:
AfghanistanAlbaniaAlgeriaAndorraAngolaAntigua and BarbudaArab WorldArgentinaArmeniaArubaAustraliaAustriaAzerbaijanBahamas, TheBahrainBangladeshBarbadosBelarusBelgiumBelizeBeninBermudaBhutanBoliviaBosnia and HerzegovinaBotswanaBrazilBrunei DarussalamBulgariaBurkina FasoBurundiCabo VerdeCambodiaCameroonCanadaCaribbean small statesCayman IslandsCentral African RepublicCentral Europe and the BalticsChadChileChinaColombiaComorosCongo, Dem. Rep.Congo, Rep.Costa RicaCote d'IvoireCroatiaCubaCyprusCzech RepublicDenmarkDjiboutiDominicaDominican RepublicEarly-demographic dividendEast Asia & PacificEast Asia & Pacific (excluding high income)East Asia & Pacific (IDA & IBRD countries)EcuadorEgypt, Arab Rep.El SalvadorEquatorial GuineaEritreaEstoniaEthiopiaEuro areaEurope & Central AsiaEurope & Central Asia (excluding high income)Europe & Central Asia (IDA & IBRD countries)European UnionFaroe IslandsFijiFinlandFragile and conflict affected situationsFranceFrench PolynesiaGabonGambia, TheGeorgiaGermanyGhanaGreeceGreenlandGrenadaGuatemalaGuineaGuinea-BissauGuyanaHaitiHeavily indebted poor countries (HIPC)High incomeHondurasHong Kong SAR, ChinaHungaryIBRD onlyIcelandIDA & IBRD totalIDA blendIDA onlyIDA totalIndiaIndonesiaIran, Islamic Rep.IraqIrelandIsraelItalyJamaicaJapanJordanKazakhstanKenyaKiribatiKorea, Rep.KuwaitKyrgyz RepublicLao PDRLate-demographic dividendLatin America & Caribbean Latin America & Caribbean (excluding high income)Latin America & the Caribbean (IDA & IBRD countries)LatviaLeast developed countries: UN classificationLebanonLesothoLiberiaLibyaLithuaniaLow & middle incomeLower middle incomeLuxembourgMacao SAR, ChinaMacedonia, FYRMadagascarMalawiMalaysiaMaldivesMaliMaltaMauritaniaMauritiusMexicoMiddle East & North AfricaMiddle East & North Africa (excluding high income)Middle East & North Africa (IDA & IBRD countries)Middle incomeMoldovaMongoliaMoroccoMozambiqueMyanmarNamibiaNepalNetherlandsNew CaledoniaNew ZealandNicaraguaNigerNigeriaNorth AmericaNorwayOECD membersOmanOther small statesPacific island small statesPakistanPalauPanamaPapua New GuineaParaguayPeruPhilippinesPolandPortugalPost-demographic dividendPre-demographic dividendQatarRomaniaRussian FederationRwandaSamoaSao Tome and PrincipeSaudi ArabiaSenegalSerbiaSeychellesSierra LeoneSingaporeSlovak RepublicSloveniaSmall statesSolomon IslandsSomaliaSouth AfricaSouth AsiaSouth Asia (IDA & IBRD)SpainSri LankaSt. Kitts and NevisSt. LuciaSt. Vincent and the GrenadinesSub-Saharan Africa Sub-Saharan Africa (excluding high income)Sub-Saharan Africa (IDA & IBRD countries)SudanSurinameSwazilandSwedenSwitzerlandSyrian Arab RepublicTajikistanTanzaniaThailandTimor-LesteTogoTongaTrinidad and TobagoTunisiaTurkeyTurkmenistanTurks and Caicos IslandsTuvaluUgandaUkraineUnited Arab EmiratesUnited KingdomUnited StatesUpper middle incomeUruguayVanuatuVenezuela, RBVietnamVirgin Islands (U.S.)WorldYemen, Rep.ZambiaZimbabwe Timeline:
This timeline shows a graph from 1972 to 2016 of Seychelles. No data until 1971. Number of actual observations by date: 44.
Source name:
World Development Indicators
Source organization:
World Bank staff estimates from the Comtrade database maintained by the United Nations Statistics Division.
Categories, topics:
Private Sector, Trade
Last updated:
apr 23, 2017
Indicators value changes by year
Maximum:
35.122
jan 1, 2012
At the date of observation
Value
Absolute change
Change from previous value
jan 1, 1972
3.732
+3.732
0.0%
jan 1, 1973
2.177
-1.555
-41.68%
jan 1, 1974
0.768
-1.408
-64.7%
jan 1, 1975
0.307
-0.462
-60.1%
jan 1, 1976
0.567
+0.261
85.09%
jan 1, 1977
1.097
+0.53
93.34%
jan 1, 1978
0.867
-0.23
-20.93%
jan 1, 1979
3.36
+2.493
287.37%
jan 1, 1980
1.511
-1.849
-55.02%
jan 1, 1981
1.798
+0.287
19.0%
jan 1, 1982
9.119
+7.32
407.02%
jan 1, 1983
0.696
-8.422
-92.36%
jan 1, 1984
0.413
-0.283
-40.69%
jan 1, 1985
8.771
+8.358
2.02K%
jan 1, 1986
6.632
-2.139
-24.38%
jan 1, 1987
0.955
-5.677
-85.6%
jan 1, 1988
0.792
-0.164
-17.13%
jan 1, 1989
0.223
-0.568
-71.79%
jan 1, 1990
0.093
-0.13
-58.29%
jan 1, 1991
0.167
+0.073
78.8%
jan 1, 1992
0.062
-0.105
-62.93%
jan 1, 1993
0.134
+0.072
116.39%
jan 1, 1994
0.792
+0.659
493.06%
jan 1, 1995
0.892
+0.099
12.51%
jan 1, 1996
1.235
+0.344
38.54%
jan 1, 1997
0.349
-0.886
-71.77%
jan 1, 1998
0.311
-0.038
-10.91%
jan 1, 1999
0.049
-0.262
-84.3%
jan 1, 2000
0.024
-0.025
-50.3%
jan 1, 2001
5.007
+4.983
20.56K%
jan 1, 2002
5.058
+0.051
1.01%
jan 1, 2003
3.547
-1.511
-29.87%
jan 1, 2004
0.258
-3.29
-92.73%
jan 1, 2005
0.494
+0.237
91.85%
jan 1, 2006
9.146
+8.652
1.75K%
jan 1, 2007
6.769
-2.377
-25.99%
jan 1, 2008
2.202
-4.567
-67.47%
jan 1, 2009
2.399
+0.197
8.94%
jan 1, 2011
11.005
+8.606
358.76%
jan 1, 2012
35.122
+24.117
219.14%
jan 1, 2013
5.913
-29.209
-83.16%
jan 1, 2014
2.328
-3.586
-60.64%
jan 1, 2015
3.159
+0.832
35.72%
jan 1, 2016
5.173
+2.014
63.74%
Ranking of countries by current statistics by years


Comments: