29
/
en
AIzaSyAYiBZKx7MnpbEhh9jyipgxe19OcubqV5w
April 1, 2024
156256
Indonesia
IDN
true
2
1
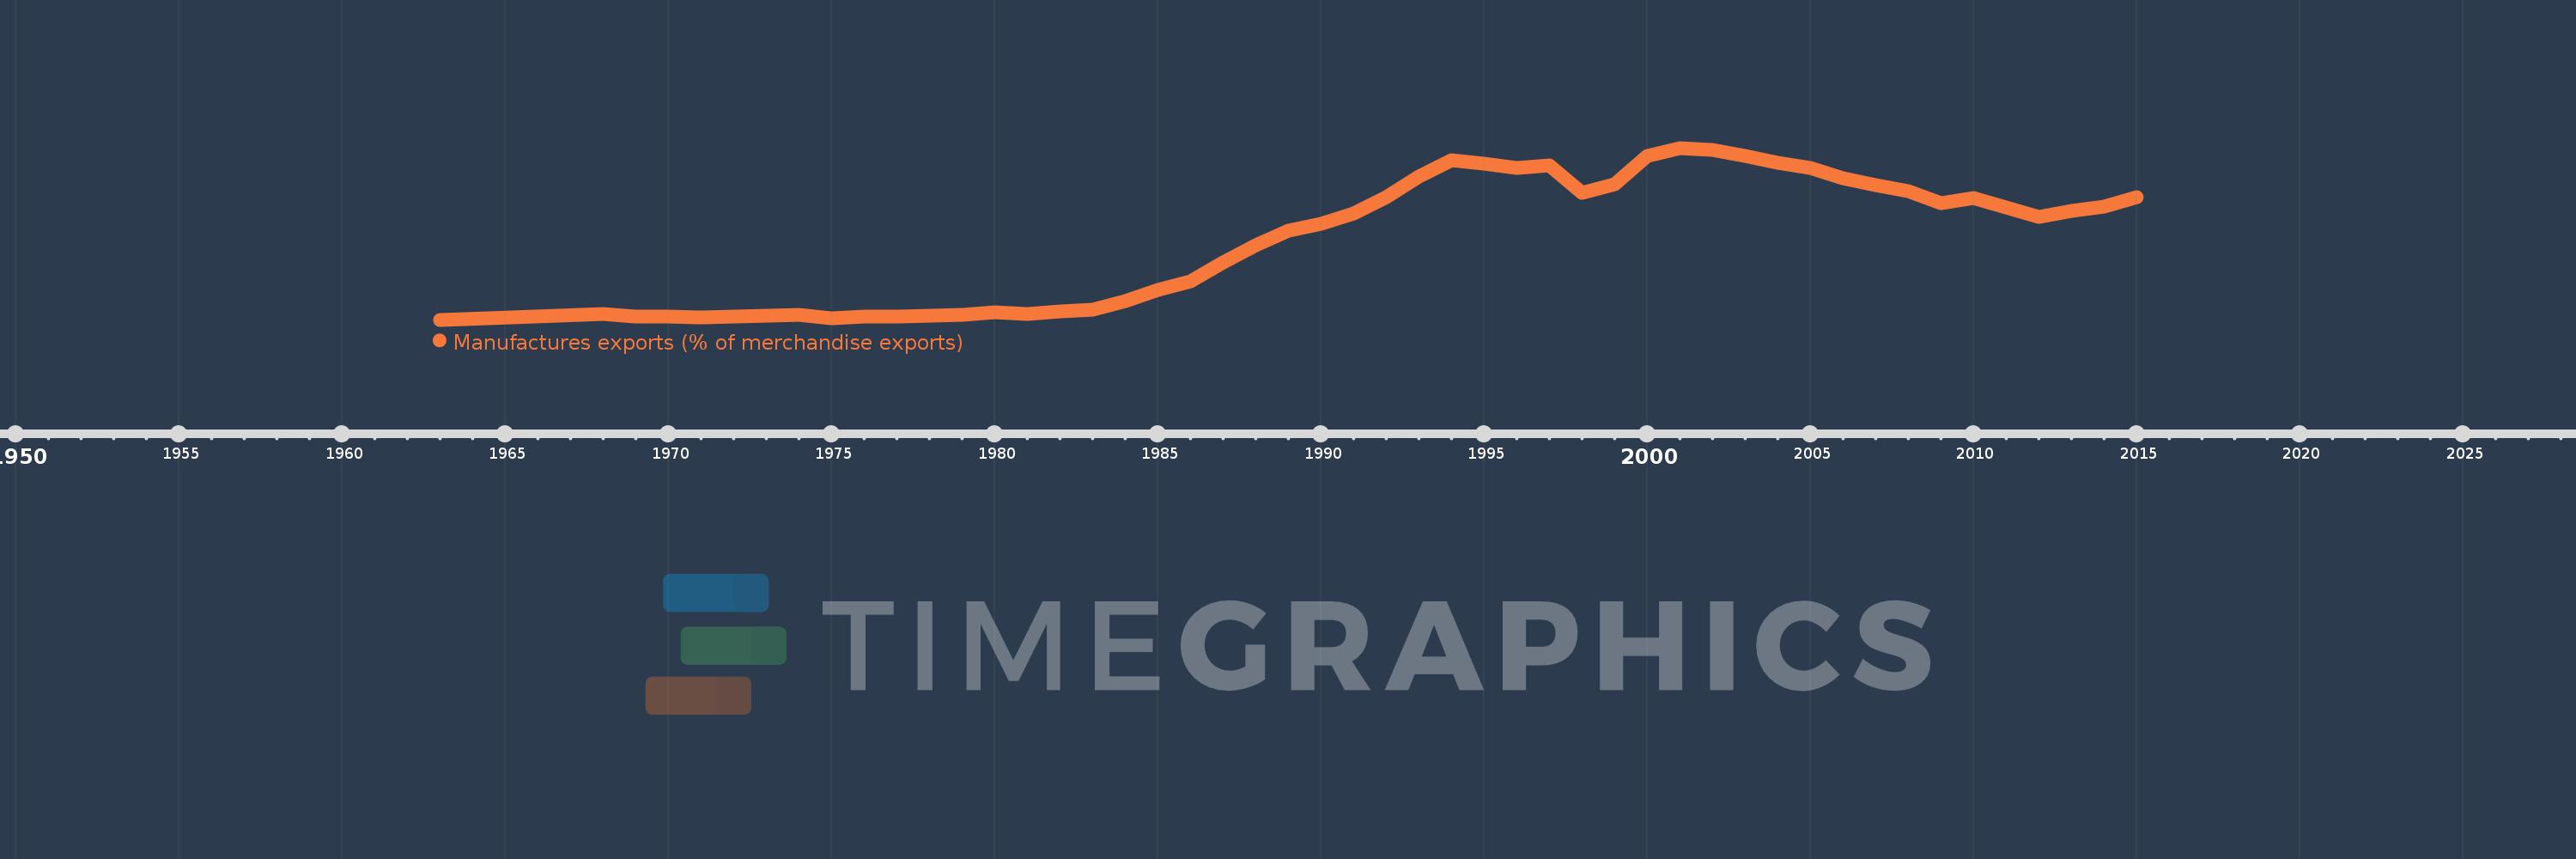
Manufactures exports (% of merchandise exports)
2015,2014,2013,2012,2011,2010,2009,2008,2007,2006,2005,2004,2003,2002,2001,2000,1999,1998,1997,1996,1995,1994,1993,1992,1991,1990,1989,1988,1987,1986,1985,1984,1983,1982,1981,1980,1979,1978,1977,1976,1975,1974,1973,1972,1971,1970,1969,1968,1963
This statistics in other country:
AfghanistanAlbaniaAlgeriaAndorraAngolaAntigua and BarbudaArab WorldArgentinaArmeniaArubaAustraliaAustriaAzerbaijanBahamas, TheBahrainBangladeshBarbadosBelarusBelgiumBelizeBeninBermudaBhutanBoliviaBosnia and HerzegovinaBotswanaBrazilBrunei DarussalamBulgariaBurkina FasoBurundiCabo VerdeCambodiaCameroonCanadaCaribbean small statesCayman IslandsCentral African RepublicCentral Europe and the BalticsChadChileChinaColombiaComorosCongo, Dem. Rep.Congo, Rep.Costa RicaCote d'IvoireCroatiaCubaCyprusCzech RepublicDenmarkDjiboutiDominicaDominican RepublicEarly-demographic dividendEast Asia & PacificEast Asia & Pacific (excluding high income)East Asia & Pacific (IDA & IBRD countries)EcuadorEgypt, Arab Rep.El SalvadorEquatorial GuineaEritreaEstoniaEthiopiaEuro areaEurope & Central AsiaEurope & Central Asia (excluding high income)Europe & Central Asia (IDA & IBRD countries)European UnionFaroe IslandsFijiFinlandFragile and conflict affected situationsFranceFrench PolynesiaGabonGambia, TheGeorgiaGermanyGhanaGreeceGreenlandGrenadaGuatemalaGuineaGuinea-BissauGuyanaHaitiHeavily indebted poor countries (HIPC)High incomeHondurasHong Kong SAR, ChinaHungaryIBRD onlyIcelandIDA & IBRD totalIDA blendIDA onlyIDA totalIndiaIndonesiaIran, Islamic Rep.IraqIrelandIsraelItalyJamaicaJapanJordanKazakhstanKenyaKiribatiKorea, Rep.KuwaitKyrgyz RepublicLao PDRLate-demographic dividendLatin America & Caribbean Latin America & Caribbean (excluding high income)Latin America & the Caribbean (IDA & IBRD countries)LatviaLeast developed countries: UN classificationLebanonLesothoLiberiaLibyaLithuaniaLow & middle incomeLower middle incomeLuxembourgMacao SAR, ChinaMacedonia, FYRMadagascarMalawiMalaysiaMaldivesMaliMaltaMauritaniaMauritiusMexicoMiddle East & North AfricaMiddle East & North Africa (excluding high income)Middle East & North Africa (IDA & IBRD countries)Middle incomeMoldovaMongoliaMoroccoMozambiqueMyanmarNamibiaNepalNetherlandsNew CaledoniaNew ZealandNicaraguaNigerNigeriaNorth AmericaNorwayOECD membersOmanOther small statesPacific island small statesPakistanPalauPanamaPapua New GuineaParaguayPeruPhilippinesPolandPortugalPost-demographic dividendPre-demographic dividendQatarRomaniaRussian FederationRwandaSamoaSao Tome and PrincipeSaudi ArabiaSenegalSerbiaSeychellesSierra LeoneSingaporeSlovak RepublicSloveniaSmall statesSolomon IslandsSomaliaSouth AfricaSouth AsiaSouth Asia (IDA & IBRD)SpainSri LankaSt. Kitts and NevisSt. LuciaSt. Vincent and the GrenadinesSub-Saharan Africa Sub-Saharan Africa (excluding high income)Sub-Saharan Africa (IDA & IBRD countries)SudanSurinameSwazilandSwedenSwitzerlandSyrian Arab RepublicTajikistanTanzaniaThailandTimor-LesteTogoTongaTrinidad and TobagoTunisiaTurkeyTurkmenistanTurks and Caicos IslandsTuvaluUgandaUkraineUnited Arab EmiratesUnited KingdomUnited StatesUpper middle incomeUruguayVanuatuVenezuela, RBVietnamVirgin Islands (U.S.)WorldYemen, Rep.ZambiaZimbabwe Timeline:
This timeline shows a graph from 1963 to 2015 of Indonesia. No data until 1962. Number of actual observations by date: 49.
Source name:
World Development Indicators
Source organization:
World Bank staff estimates from the Comtrade database maintained by the United Nations Statistics Division.
Categories, topics:
Private Sector, Trade
Last updated:
apr 23, 2017
Indicators value changes by year
Maximum:
57.122
jan 1, 2001
At the date of observation
Value
Absolute change
Change from previous value
jan 1, 1963
0.271
+0.271
0.0%
jan 1, 1968
2.082
+1.811
669.48%
jan 1, 1969
1.445
-0.637
-30.59%
jan 1, 1970
1.385
-0.06
-4.14%
jan 1, 1971
1.152
-0.233
-16.84%
jan 1, 1972
1.406
+0.254
22.07%
jan 1, 1973
1.727
+0.321
22.79%
jan 1, 1974
1.887
+0.16
9.28%
jan 1, 1975
0.825
-1.062
-56.3%
jan 1, 1976
1.197
+0.372
45.14%
jan 1, 1977
1.391
+0.194
16.22%
jan 1, 1978
1.64
+0.248
17.86%
jan 1, 1979
1.773
+0.134
8.15%
jan 1, 1980
2.875
+1.102
62.13%
jan 1, 1981
2.285
-0.59
-20.52%
jan 1, 1982
3.02
+0.735
32.18%
jan 1, 1983
3.626
+0.606
20.06%
jan 1, 1984
6.526
+2.9
79.97%
jan 1, 1985
10.057
+3.531
54.11%
jan 1, 1986
13.04
+2.982
29.65%
jan 1, 1987
19.291
+6.251
47.94%
jan 1, 1988
25.023
+5.732
29.71%
jan 1, 1989
29.749
+4.727
18.89%
jan 1, 1990
31.943
+2.193
7.37%
jan 1, 1991
35.453
+3.511
10.99%
jan 1, 1992
40.794
+5.341
15.07%
jan 1, 1993
47.524
+6.729
16.5%
jan 1, 1994
53.086
+5.562
11.7%
jan 1, 1995
51.835
-1.251
-2.36%
jan 1, 1996
50.614
-1.221
-2.36%
jan 1, 1997
51.433
+0.819
1.62%
jan 1, 1998
42.341
-9.092
-17.68%
jan 1, 1999
44.988
+2.647
6.25%
jan 1, 2000
54.442
+9.454
21.01%
jan 1, 2001
57.122
+2.68
4.92%
jan 1, 2002
56.429
-0.693
-1.21%
jan 1, 2003
54.428
-2.0
-3.54%
jan 1, 2004
52.113
-2.316
-4.25%
jan 1, 2005
50.48
-1.633
-3.13%
jan 1, 2006
47.176
-3.304
-6.55%
jan 1, 2007
44.687
-2.489
-5.28%
jan 1, 2008
42.93
-1.757
-3.93%
jan 1, 2009
38.812
-4.117
-9.59%
jan 1, 2010
40.581
+1.769
4.56%
jan 1, 2011
37.498
-3.083
-7.6%
jan 1, 2012
34.161
-3.337
-8.9%
jan 1, 2013
36.177
+2.016
5.9%
jan 1, 2014
37.801
+1.624
4.49%
jan 1, 2015
40.935
+3.134
8.29%
Ranking of countries by current statistics by years


Comments: