29
/
en
AIzaSyAYiBZKx7MnpbEhh9jyipgxe19OcubqV5w
April 1, 2024
267082
Trinidad and Tobago
TTO
true
2
1
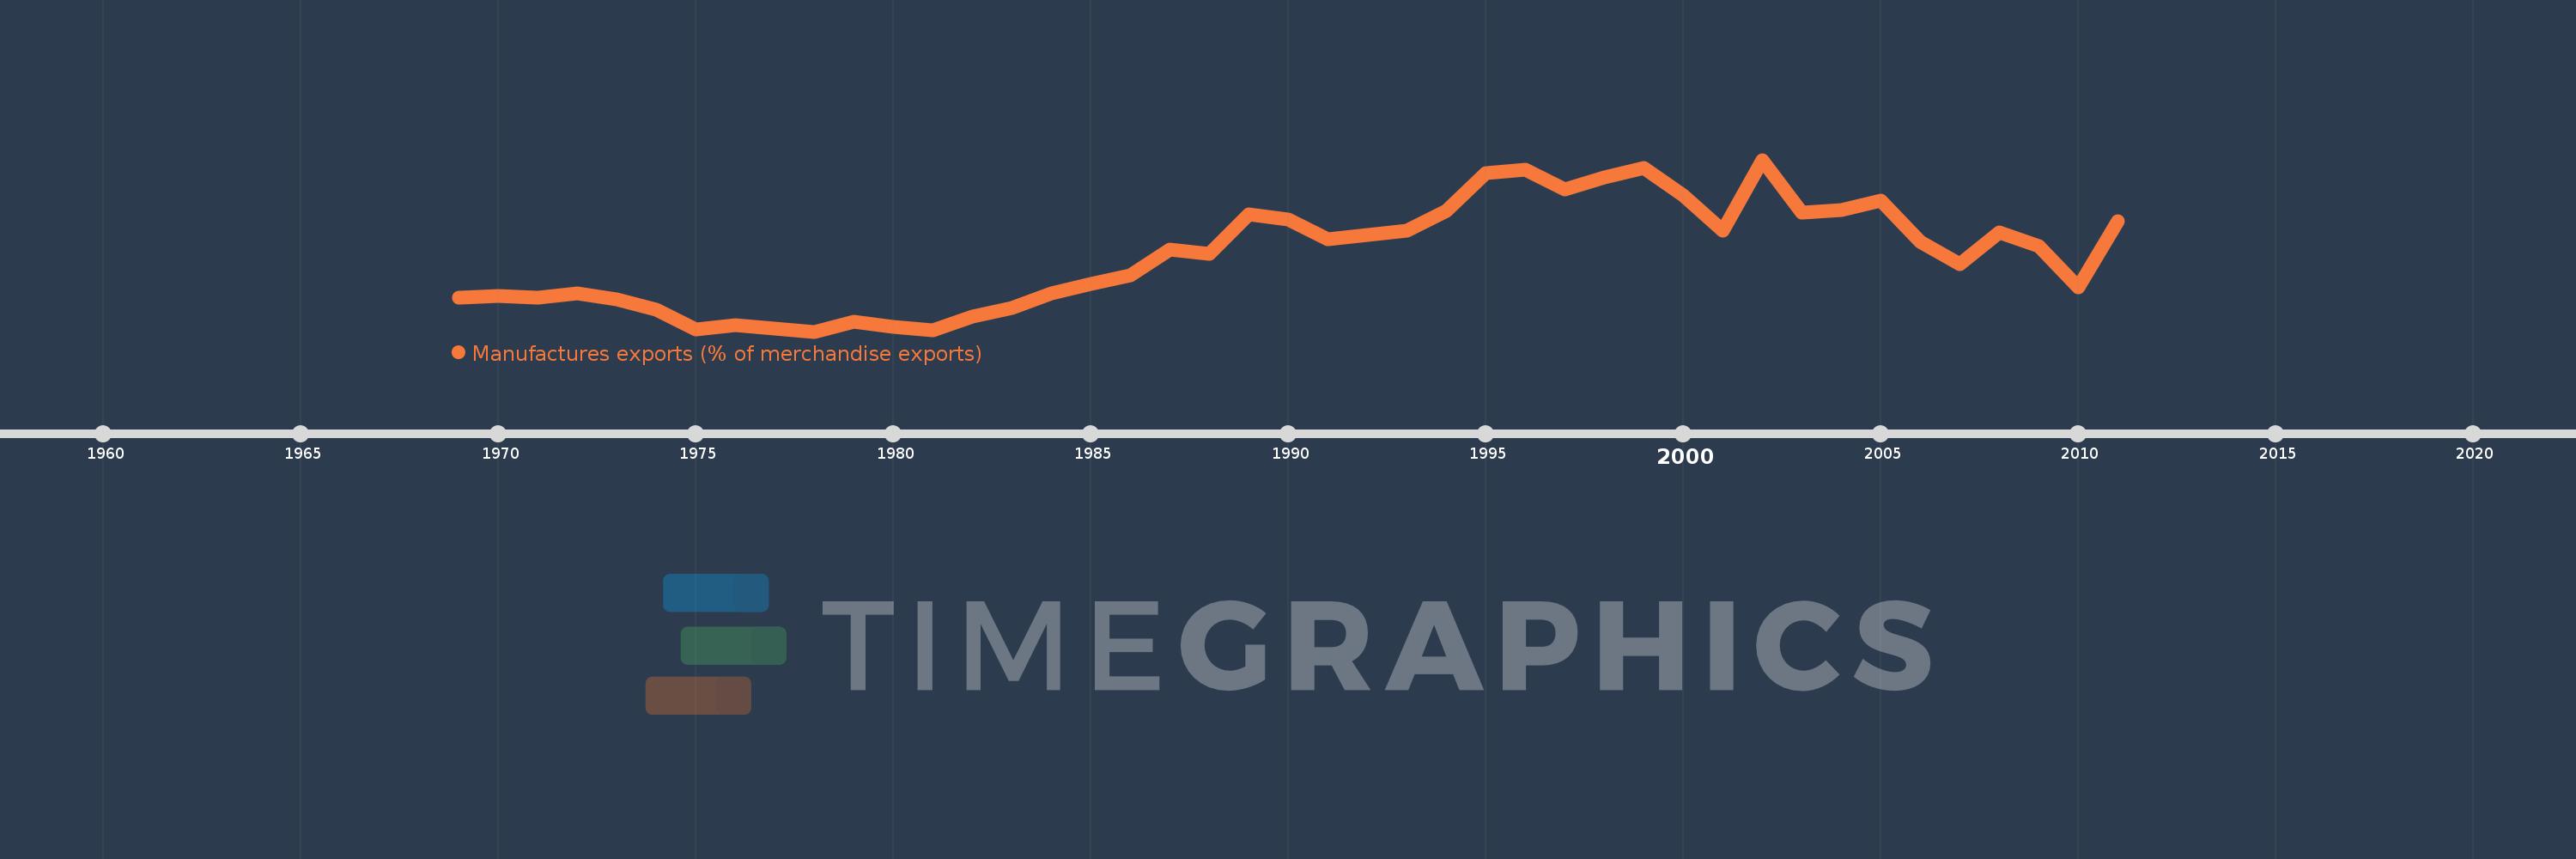
Manufactures exports (% of merchandise exports)
2011,2010,2009,2008,2007,2006,2005,2004,2003,2002,2001,2000,1999,1998,1997,1996,1995,1994,1993,1992,1991,1990,1989,1988,1987,1986,1985,1984,1983,1982,1981,1980,1979,1978,1977,1976,1975,1974,1973,1972,1971,1970,1969
This statistics in other country:
AfghanistanAlbaniaAlgeriaAndorraAngolaAntigua and BarbudaArab WorldArgentinaArmeniaArubaAustraliaAustriaAzerbaijanBahamas, TheBahrainBangladeshBarbadosBelarusBelgiumBelizeBeninBermudaBhutanBoliviaBosnia and HerzegovinaBotswanaBrazilBrunei DarussalamBulgariaBurkina FasoBurundiCabo VerdeCambodiaCameroonCanadaCaribbean small statesCayman IslandsCentral African RepublicCentral Europe and the BalticsChadChileChinaColombiaComorosCongo, Dem. Rep.Congo, Rep.Costa RicaCote d'IvoireCroatiaCubaCyprusCzech RepublicDenmarkDjiboutiDominicaDominican RepublicEarly-demographic dividendEast Asia & PacificEast Asia & Pacific (excluding high income)East Asia & Pacific (IDA & IBRD countries)EcuadorEgypt, Arab Rep.El SalvadorEquatorial GuineaEritreaEstoniaEthiopiaEuro areaEurope & Central AsiaEurope & Central Asia (excluding high income)Europe & Central Asia (IDA & IBRD countries)European UnionFaroe IslandsFijiFinlandFragile and conflict affected situationsFranceFrench PolynesiaGabonGambia, TheGeorgiaGermanyGhanaGreeceGreenlandGrenadaGuatemalaGuineaGuinea-BissauGuyanaHaitiHeavily indebted poor countries (HIPC)High incomeHondurasHong Kong SAR, ChinaHungaryIBRD onlyIcelandIDA & IBRD totalIDA blendIDA onlyIDA totalIndiaIndonesiaIran, Islamic Rep.IraqIrelandIsraelItalyJamaicaJapanJordanKazakhstanKenyaKiribatiKorea, Rep.KuwaitKyrgyz RepublicLao PDRLate-demographic dividendLatin America & Caribbean Latin America & Caribbean (excluding high income)Latin America & the Caribbean (IDA & IBRD countries)LatviaLeast developed countries: UN classificationLebanonLesothoLiberiaLibyaLithuaniaLow & middle incomeLower middle incomeLuxembourgMacao SAR, ChinaMacedonia, FYRMadagascarMalawiMalaysiaMaldivesMaliMaltaMauritaniaMauritiusMexicoMiddle East & North AfricaMiddle East & North Africa (excluding high income)Middle East & North Africa (IDA & IBRD countries)Middle incomeMoldovaMongoliaMoroccoMozambiqueMyanmarNamibiaNepalNetherlandsNew CaledoniaNew ZealandNicaraguaNigerNigeriaNorth AmericaNorwayOECD membersOmanOther small statesPacific island small statesPakistanPalauPanamaPapua New GuineaParaguayPeruPhilippinesPolandPortugalPost-demographic dividendPre-demographic dividendQatarRomaniaRussian FederationRwandaSamoaSao Tome and PrincipeSaudi ArabiaSenegalSerbiaSeychellesSierra LeoneSingaporeSlovak RepublicSloveniaSmall statesSolomon IslandsSomaliaSouth AfricaSouth AsiaSouth Asia (IDA & IBRD)SpainSri LankaSt. Kitts and NevisSt. LuciaSt. Vincent and the GrenadinesSub-Saharan Africa Sub-Saharan Africa (excluding high income)Sub-Saharan Africa (IDA & IBRD countries)SudanSurinameSwazilandSwedenSwitzerlandSyrian Arab RepublicTajikistanTanzaniaThailandTimor-LesteTogoTongaTrinidad and TobagoTunisiaTurkeyTurkmenistanTurks and Caicos IslandsTuvaluUgandaUkraineUnited Arab EmiratesUnited KingdomUnited StatesUpper middle incomeUruguayVanuatuVenezuela, RBVietnamVirgin Islands (U.S.)WorldYemen, Rep.ZambiaZimbabwe Timeline:
This timeline shows a graph from 1969 to 2011 of Trinidad and Tobago. No data until 1968. Number of actual observations by date: 43.
Source name:
World Development Indicators
Source organization:
World Bank staff estimates from the Comtrade database maintained by the United Nations Statistics Division.
Categories, topics:
Private Sector, Trade
Last updated:
apr 23, 2017
Indicators value changes by year
Maximum:
45.698
jan 1, 2002
At the date of observation
Value
Absolute change
Change from previous value
jan 1, 1969
12.787
+12.787
0.0%
jan 1, 1970
13.3
+0.512
4.01%
jan 1, 1971
12.829
-0.471
-3.54%
jan 1, 1972
13.78
+0.951
7.42%
jan 1, 1973
12.425
-1.355
-9.83%
jan 1, 1974
10.053
-2.372
-19.09%
jan 1, 1975
5.339
-4.714
-46.89%
jan 1, 1976
6.244
+0.905
16.94%
jan 1, 1977
5.481
-0.763
-12.22%
jan 1, 1978
4.746
-0.735
-13.41%
jan 1, 1979
7.086
+2.341
49.32%
jan 1, 1980
5.874
-1.212
-17.1%
jan 1, 1981
4.968
-0.906
-15.43%
jan 1, 1982
8.249
+3.281
66.05%
jan 1, 1983
10.316
+2.066
25.05%
jan 1, 1984
13.888
+3.573
34.64%
jan 1, 1985
16.156
+2.268
16.33%
jan 1, 1986
18.186
+2.03
12.56%
jan 1, 1987
24.331
+6.146
33.79%
jan 1, 1988
23.377
-0.955
-3.92%
jan 1, 1989
32.67
+9.294
39.76%
jan 1, 1990
31.512
-1.158
-3.55%
jan 1, 1991
26.683
-4.829
-15.32%
jan 1, 1992
27.861
+1.178
4.42%
jan 1, 1993
28.872
+1.011
3.63%
jan 1, 1994
33.585
+4.713
16.32%
jan 1, 1995
42.553
+8.968
26.7%
jan 1, 1996
43.339
+0.786
1.85%
jan 1, 1997
38.658
-4.681
-10.8%
jan 1, 1998
41.567
+2.909
7.53%
jan 1, 1999
43.818
+2.251
5.41%
jan 1, 2000
37.209
-6.609
-15.08%
jan 1, 2001
28.826
-8.383
-22.53%
jan 1, 2002
45.698
+16.873
58.53%
jan 1, 2003
33.148
-12.551
-27.46%
jan 1, 2004
33.73
+0.583
1.76%
jan 1, 2005
35.966
+2.236
6.63%
jan 1, 2006
26.204
-9.762
-27.14%
jan 1, 2007
20.887
-5.317
-20.29%
jan 1, 2008
28.493
+7.606
36.42%
jan 1, 2009
25.097
-3.396
-11.92%
jan 1, 2010
15.267
-9.83
-39.17%
jan 1, 2011
31.018
+15.751
103.17%
Ranking of countries by current statistics by years


Comments: