29
/
en
AIzaSyAYiBZKx7MnpbEhh9jyipgxe19OcubqV5w
April 1, 2024
123760
Ecuador
ECU
true
2
1
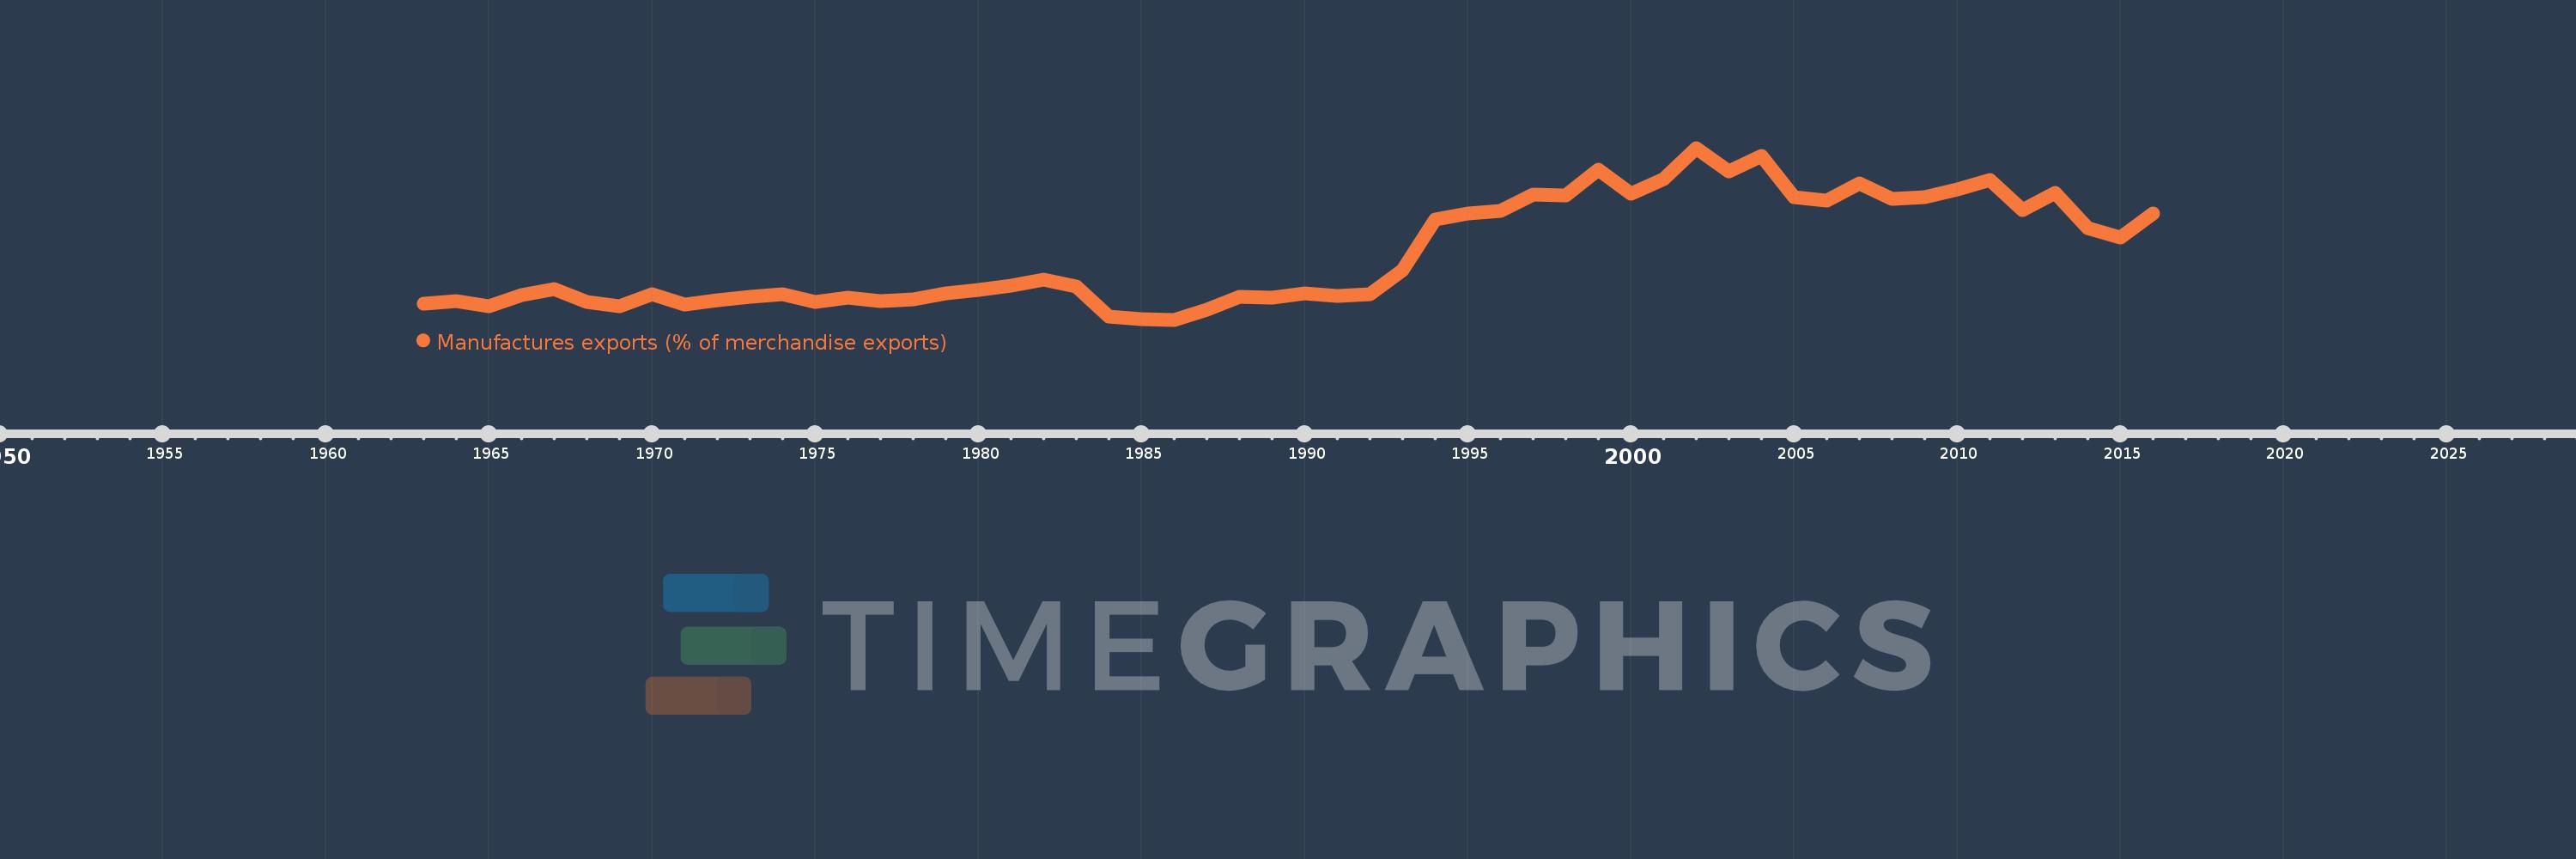
Manufactures exports (% of merchandise exports)
2016,2015,2014,2013,2012,2011,2010,2009,2008,2007,2006,2005,2004,2003,2002,2001,2000,1999,1998,1997,1996,1995,1994,1993,1992,1991,1990,1989,1988,1987,1986,1985,1984,1983,1982,1981,1980,1979,1978,1977,1976,1975,1974,1973,1972,1971,1970,1969,1968,1967,1966,1965,1964,1963
This statistics in other country:
AfghanistanAlbaniaAlgeriaAndorraAngolaAntigua and BarbudaArab WorldArgentinaArmeniaArubaAustraliaAustriaAzerbaijanBahamas, TheBahrainBangladeshBarbadosBelarusBelgiumBelizeBeninBermudaBhutanBoliviaBosnia and HerzegovinaBotswanaBrazilBrunei DarussalamBulgariaBurkina FasoBurundiCabo VerdeCambodiaCameroonCanadaCaribbean small statesCayman IslandsCentral African RepublicCentral Europe and the BalticsChadChileChinaColombiaComorosCongo, Dem. Rep.Congo, Rep.Costa RicaCote d'IvoireCroatiaCubaCyprusCzech RepublicDenmarkDjiboutiDominicaDominican RepublicEarly-demographic dividendEast Asia & PacificEast Asia & Pacific (excluding high income)East Asia & Pacific (IDA & IBRD countries)EcuadorEgypt, Arab Rep.El SalvadorEquatorial GuineaEritreaEstoniaEthiopiaEuro areaEurope & Central AsiaEurope & Central Asia (excluding high income)Europe & Central Asia (IDA & IBRD countries)European UnionFaroe IslandsFijiFinlandFragile and conflict affected situationsFranceFrench PolynesiaGabonGambia, TheGeorgiaGermanyGhanaGreeceGreenlandGrenadaGuatemalaGuineaGuinea-BissauGuyanaHaitiHeavily indebted poor countries (HIPC)High incomeHondurasHong Kong SAR, ChinaHungaryIBRD onlyIcelandIDA & IBRD totalIDA blendIDA onlyIDA totalIndiaIndonesiaIran, Islamic Rep.IraqIrelandIsraelItalyJamaicaJapanJordanKazakhstanKenyaKiribatiKorea, Rep.KuwaitKyrgyz RepublicLao PDRLate-demographic dividendLatin America & Caribbean Latin America & Caribbean (excluding high income)Latin America & the Caribbean (IDA & IBRD countries)LatviaLeast developed countries: UN classificationLebanonLesothoLiberiaLibyaLithuaniaLow & middle incomeLower middle incomeLuxembourgMacao SAR, ChinaMacedonia, FYRMadagascarMalawiMalaysiaMaldivesMaliMaltaMauritaniaMauritiusMexicoMiddle East & North AfricaMiddle East & North Africa (excluding high income)Middle East & North Africa (IDA & IBRD countries)Middle incomeMoldovaMongoliaMoroccoMozambiqueMyanmarNamibiaNepalNetherlandsNew CaledoniaNew ZealandNicaraguaNigerNigeriaNorth AmericaNorwayOECD membersOmanOther small statesPacific island small statesPakistanPalauPanamaPapua New GuineaParaguayPeruPhilippinesPolandPortugalPost-demographic dividendPre-demographic dividendQatarRomaniaRussian FederationRwandaSamoaSao Tome and PrincipeSaudi ArabiaSenegalSerbiaSeychellesSierra LeoneSingaporeSlovak RepublicSloveniaSmall statesSolomon IslandsSomaliaSouth AfricaSouth AsiaSouth Asia (IDA & IBRD)SpainSri LankaSt. Kitts and NevisSt. LuciaSt. Vincent and the GrenadinesSub-Saharan Africa Sub-Saharan Africa (excluding high income)Sub-Saharan Africa (IDA & IBRD countries)SudanSurinameSwazilandSwedenSwitzerlandSyrian Arab RepublicTajikistanTanzaniaThailandTimor-LesteTogoTongaTrinidad and TobagoTunisiaTurkeyTurkmenistanTurks and Caicos IslandsTuvaluUgandaUkraineUnited Arab EmiratesUnited KingdomUnited StatesUpper middle incomeUruguayVanuatuVenezuela, RBVietnamVirgin Islands (U.S.)WorldYemen, Rep.ZambiaZimbabwe Timeline:
This timeline shows a graph from 1963 to 2016 of Ecuador. No data until 1962. Number of actual observations by date: 54.
Source name:
World Development Indicators
Source organization:
World Bank staff estimates from the Comtrade database maintained by the United Nations Statistics Division.
Categories, topics:
Private Sector, Trade
Last updated:
apr 23, 2017
Indicators value changes by year
Maximum:
11.899
jan 1, 2002
At the date of observation
Value
Absolute change
Change from previous value
jan 1, 1963
1.804
+1.804
0.0%
jan 1, 1964
1.974
+0.171
9.47%
jan 1, 1965
1.663
-0.311
-15.78%
jan 1, 1966
2.373
+0.71
42.72%
jan 1, 1967
2.783
+0.41
17.27%
jan 1, 1968
1.909
-0.874
-31.41%
jan 1, 1969
1.642
-0.267
-13.97%
jan 1, 1970
2.438
+0.795
48.41%
jan 1, 1971
1.755
-0.682
-28.0%
jan 1, 1972
2.019
+0.263
15.01%
jan 1, 1973
2.254
+0.235
11.64%
jan 1, 1974
2.446
+0.193
8.55%
jan 1, 1975
1.911
-0.535
-21.87%
jan 1, 1976
2.219
+0.307
16.09%
jan 1, 1977
1.995
-0.224
-10.08%
jan 1, 1978
2.093
+0.098
4.9%
jan 1, 1979
2.496
+0.403
19.26%
jan 1, 1980
2.727
+0.231
9.27%
jan 1, 1981
2.994
+0.267
9.8%
jan 1, 1982
3.358
+0.364
12.14%
jan 1, 1983
2.921
-0.437
-13.0%
jan 1, 1984
0.979
-1.943
-66.5%
jan 1, 1985
0.805
-0.174
-17.73%
jan 1, 1986
0.783
-0.023
-2.8%
jan 1, 1987
1.406
+0.624
79.69%
jan 1, 1988
2.268
+0.862
61.27%
jan 1, 1989
2.223
-0.045
-1.97%
jan 1, 1990
2.481
+0.258
11.6%
jan 1, 1991
2.323
-0.158
-6.36%
jan 1, 1992
2.438
+0.115
4.94%
jan 1, 1993
3.963
+1.525
62.57%
jan 1, 1994
7.252
+3.289
82.99%
jan 1, 1995
7.666
+0.414
5.71%
jan 1, 1996
7.814
+0.148
1.93%
jan 1, 1997
8.872
+1.058
13.54%
jan 1, 1998
8.826
-0.046
-0.52%
jan 1, 1999
10.481
+1.655
18.75%
jan 1, 2000
8.929
-1.552
-14.81%
jan 1, 2001
9.9
+0.971
10.87%
jan 1, 2002
11.899
+1.999
20.19%
jan 1, 2003
10.377
-1.522
-12.79%
jan 1, 2004
11.399
+1.023
9.86%
jan 1, 2005
8.723
-2.676
-23.47%
jan 1, 2006
8.517
-0.206
-2.37%
jan 1, 2007
9.627
+1.11
13.04%
jan 1, 2008
8.61
-1.017
-10.57%
jan 1, 2009
8.706
+0.096
1.12%
jan 1, 2010
9.232
+0.526
6.04%
jan 1, 2011
9.844
+0.612
6.63%
jan 1, 2012
7.894
-1.95
-19.81%
jan 1, 2013
8.981
+1.087
13.77%
jan 1, 2014
6.728
-2.253
-25.09%
jan 1, 2015
6.126
-0.602
-8.95%
jan 1, 2016
7.667
+1.541
25.15%
Ranking of countries by current statistics by years


Comments: