29
/
en
AIzaSyAYiBZKx7MnpbEhh9jyipgxe19OcubqV5w
April 1, 2024
43620
Latin America & the Caribbean (IDA & IBRD countries)
TLA
false
2
1
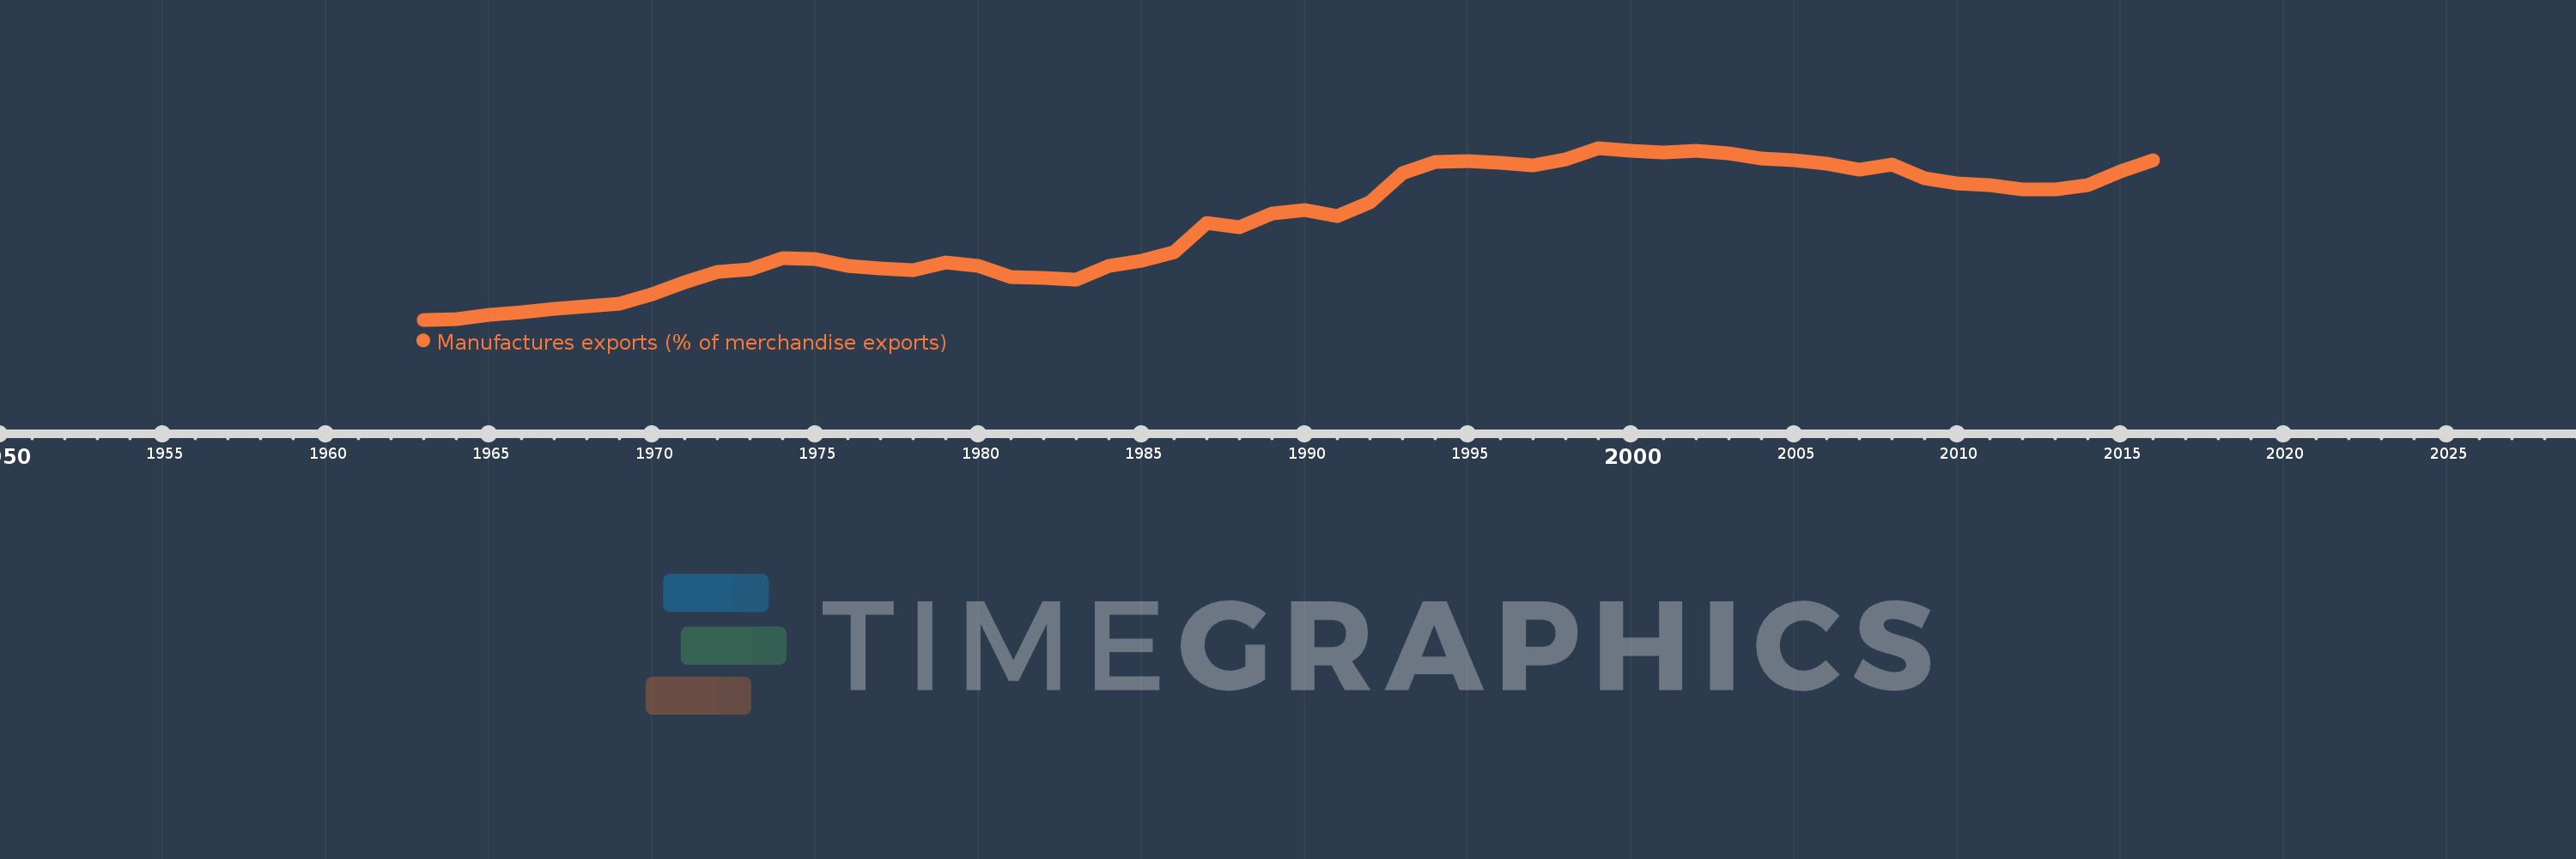
Manufactures exports (% of merchandise exports)
2016,2015,2014,2013,2012,2011,2010,2009,2008,2007,2006,2005,2004,2003,2002,2001,2000,1999,1998,1997,1996,1995,1994,1993,1992,1991,1990,1989,1988,1987,1986,1985,1984,1983,1982,1981,1980,1979,1978,1977,1976,1975,1974,1973,1972,1971,1970,1969,1968,1967,1966,1965,1964,1963
This statistics in other country:
AfghanistanAlbaniaAlgeriaAndorraAngolaAntigua and BarbudaArab WorldArgentinaArmeniaArubaAustraliaAustriaAzerbaijanBahamas, TheBahrainBangladeshBarbadosBelarusBelgiumBelizeBeninBermudaBhutanBoliviaBosnia and HerzegovinaBotswanaBrazilBrunei DarussalamBulgariaBurkina FasoBurundiCabo VerdeCambodiaCameroonCanadaCaribbean small statesCayman IslandsCentral African RepublicCentral Europe and the BalticsChadChileChinaColombiaComorosCongo, Dem. Rep.Congo, Rep.Costa RicaCote d'IvoireCroatiaCubaCyprusCzech RepublicDenmarkDjiboutiDominicaDominican RepublicEarly-demographic dividendEast Asia & PacificEast Asia & Pacific (excluding high income)East Asia & Pacific (IDA & IBRD countries)EcuadorEgypt, Arab Rep.El SalvadorEquatorial GuineaEritreaEstoniaEthiopiaEuro areaEurope & Central AsiaEurope & Central Asia (excluding high income)Europe & Central Asia (IDA & IBRD countries)European UnionFaroe IslandsFijiFinlandFragile and conflict affected situationsFranceFrench PolynesiaGabonGambia, TheGeorgiaGermanyGhanaGreeceGreenlandGrenadaGuatemalaGuineaGuinea-BissauGuyanaHaitiHeavily indebted poor countries (HIPC)High incomeHondurasHong Kong SAR, ChinaHungaryIBRD onlyIcelandIDA & IBRD totalIDA blendIDA onlyIDA totalIndiaIndonesiaIran, Islamic Rep.IraqIrelandIsraelItalyJamaicaJapanJordanKazakhstanKenyaKiribatiKorea, Rep.KuwaitKyrgyz RepublicLao PDRLate-demographic dividendLatin America & Caribbean Latin America & Caribbean (excluding high income)Latin America & the Caribbean (IDA & IBRD countries)LatviaLeast developed countries: UN classificationLebanonLesothoLiberiaLibyaLithuaniaLow & middle incomeLower middle incomeLuxembourgMacao SAR, ChinaMacedonia, FYRMadagascarMalawiMalaysiaMaldivesMaliMaltaMauritaniaMauritiusMexicoMiddle East & North AfricaMiddle East & North Africa (excluding high income)Middle East & North Africa (IDA & IBRD countries)Middle incomeMoldovaMongoliaMoroccoMozambiqueMyanmarNamibiaNepalNetherlandsNew CaledoniaNew ZealandNicaraguaNigerNigeriaNorth AmericaNorwayOECD membersOmanOther small statesPacific island small statesPakistanPalauPanamaPapua New GuineaParaguayPeruPhilippinesPolandPortugalPost-demographic dividendPre-demographic dividendQatarRomaniaRussian FederationRwandaSamoaSao Tome and PrincipeSaudi ArabiaSenegalSerbiaSeychellesSierra LeoneSingaporeSlovak RepublicSloveniaSmall statesSolomon IslandsSomaliaSouth AfricaSouth AsiaSouth Asia (IDA & IBRD)SpainSri LankaSt. Kitts and NevisSt. LuciaSt. Vincent and the GrenadinesSub-Saharan Africa Sub-Saharan Africa (excluding high income)Sub-Saharan Africa (IDA & IBRD countries)SudanSurinameSwazilandSwedenSwitzerlandSyrian Arab RepublicTajikistanTanzaniaThailandTimor-LesteTogoTongaTrinidad and TobagoTunisiaTurkeyTurkmenistanTurks and Caicos IslandsTuvaluUgandaUkraineUnited Arab EmiratesUnited KingdomUnited StatesUpper middle incomeUruguayVanuatuVenezuela, RBVietnamVirgin Islands (U.S.)WorldYemen, Rep.ZambiaZimbabwe Timeline:
This timeline shows a graph from 1963 to 2016 of Latin America & the Caribbean (IDA & IBRD countries). No data until 1962. Number of actual observations by date: 54.
Source name:
World Development Indicators
Source organization:
World Bank staff estimates from the Comtrade database maintained by the United Nations Statistics Division.
Categories, topics:
Private Sector, Trade
Last updated:
apr 23, 2017
Indicators value changes by year
Maximum:
52.602
jan 1, 1999
At the date of observation
Value
Absolute change
Change from previous value
jan 1, 1963
7.451
+7.451
0.0%
jan 1, 1964
7.586
+0.136
1.82%
jan 1, 1965
8.726
+1.14
15.02%
jan 1, 1966
9.342
+0.616
7.06%
jan 1, 1967
10.388
+1.046
11.19%
jan 1, 1968
11.059
+0.672
6.46%
jan 1, 1969
11.638
+0.579
5.23%
jan 1, 1970
14.102
+2.464
21.17%
jan 1, 1971
17.353
+3.251
23.05%
jan 1, 1972
20.025
+2.671
15.39%
jan 1, 1973
20.653
+0.628
3.14%
jan 1, 1974
23.577
+2.924
14.16%
jan 1, 1975
23.524
-0.053
-0.23%
jan 1, 1976
21.638
-1.886
-8.02%
jan 1, 1977
20.823
-0.815
-3.77%
jan 1, 1978
20.489
-0.333
-1.6%
jan 1, 1979
22.569
+2.08
10.15%
jan 1, 1980
21.709
-0.859
-3.81%
jan 1, 1981
18.577
-3.132
-14.43%
jan 1, 1982
18.51
-0.067
-0.36%
jan 1, 1983
17.944
-0.566
-3.06%
jan 1, 1984
21.637
+3.693
20.58%
jan 1, 1985
22.912
+1.275
5.89%
jan 1, 1986
25.144
+2.233
9.74%
jan 1, 1987
32.929
+7.785
30.96%
jan 1, 1988
31.693
-1.236
-3.75%
jan 1, 1989
35.292
+3.599
11.36%
jan 1, 1990
36.364
+1.072
3.04%
jan 1, 1991
34.81
-1.554
-4.27%
jan 1, 1992
38.406
+3.597
10.33%
jan 1, 1993
46.083
+7.676
19.99%
jan 1, 1994
48.981
+2.898
6.29%
jan 1, 1995
49.236
+0.255
0.52%
jan 1, 1996
48.691
-0.545
-1.11%
jan 1, 1997
48.003
-0.688
-1.41%
jan 1, 1998
49.502
+1.499
3.12%
jan 1, 1999
52.602
+3.1
6.26%
jan 1, 2000
51.831
-0.771
-1.46%
jan 1, 2001
51.513
-0.318
-0.61%
jan 1, 2002
51.911
+0.397
0.77%
jan 1, 2003
51.09
-0.82
-1.58%
jan 1, 2004
49.845
-1.245
-2.44%
jan 1, 2005
49.395
-0.45
-0.9%
jan 1, 2006
48.394
-1.001
-2.03%
jan 1, 2007
46.851
-1.543
-3.19%
jan 1, 2008
48.196
+1.346
2.87%
jan 1, 2009
44.735
-3.461
-7.18%
jan 1, 2010
43.386
-1.349
-3.01%
jan 1, 2011
42.885
-0.501
-1.16%
jan 1, 2012
41.624
-1.261
-2.94%
jan 1, 2013
41.753
+0.129
0.31%
jan 1, 2014
42.803
+1.05
2.51%
jan 1, 2015
46.45
+3.648
8.52%
jan 1, 2016
49.333
+2.882
6.21%
Ranking of countries by current statistics by years


Comments: