29
/
en
AIzaSyAYiBZKx7MnpbEhh9jyipgxe19OcubqV5w
April 1, 2024
111187
Congo, Rep.
COG
true
2
1
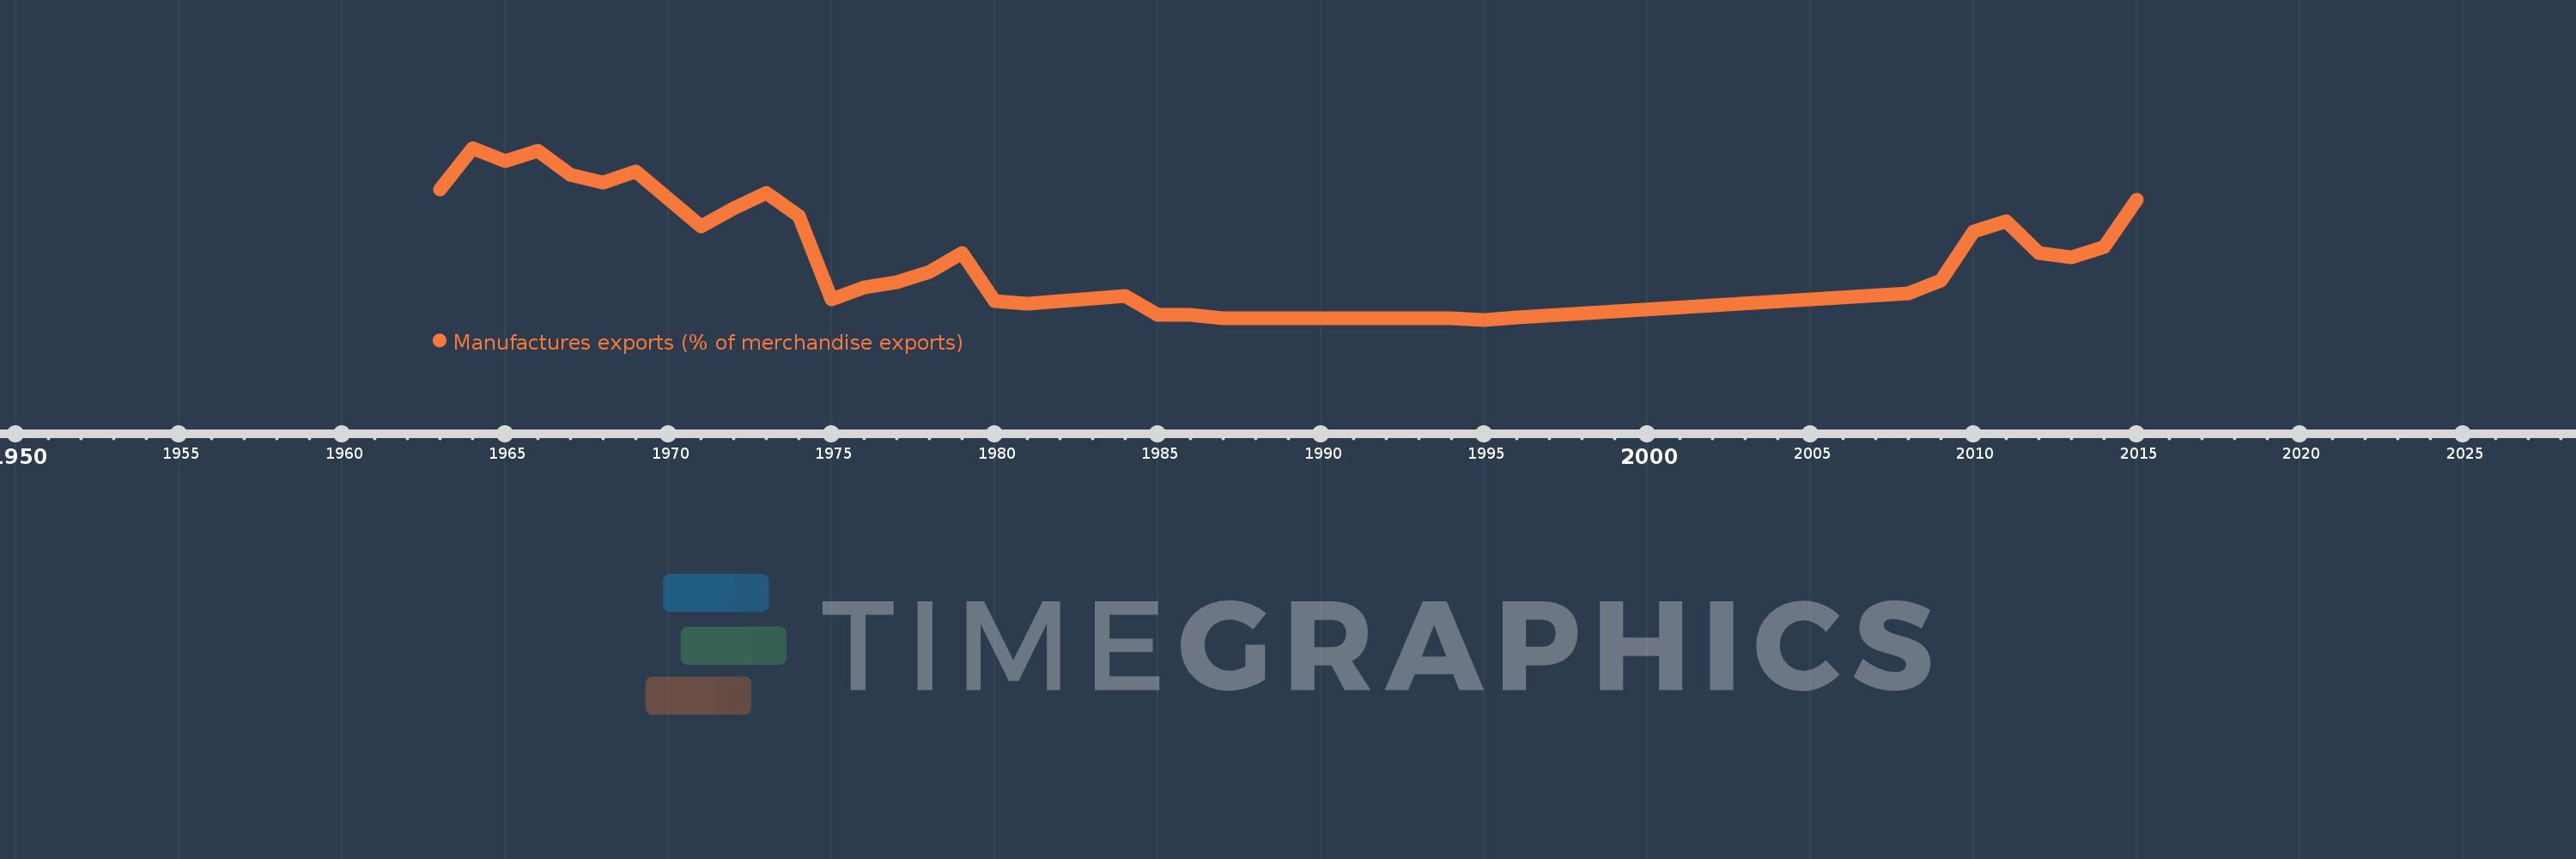
Manufactures exports (% of merchandise exports)
2015,2014,2013,2012,2011,2010,2009,2008,1996,1995,1994,1987,1986,1985,1984,1981,1980,1979,1978,1977,1976,1975,1974,1973,1972,1971,1969,1968,1967,1966,1965,1964,1963
This statistics in other country:
AfghanistanAlbaniaAlgeriaAndorraAngolaAntigua and BarbudaArab WorldArgentinaArmeniaArubaAustraliaAustriaAzerbaijanBahamas, TheBahrainBangladeshBarbadosBelarusBelgiumBelizeBeninBermudaBhutanBoliviaBosnia and HerzegovinaBotswanaBrazilBrunei DarussalamBulgariaBurkina FasoBurundiCabo VerdeCambodiaCameroonCanadaCaribbean small statesCayman IslandsCentral African RepublicCentral Europe and the BalticsChadChileChinaColombiaComorosCongo, Dem. Rep.Congo, Rep.Costa RicaCote d'IvoireCroatiaCubaCyprusCzech RepublicDenmarkDjiboutiDominicaDominican RepublicEarly-demographic dividendEast Asia & PacificEast Asia & Pacific (excluding high income)East Asia & Pacific (IDA & IBRD countries)EcuadorEgypt, Arab Rep.El SalvadorEquatorial GuineaEritreaEstoniaEthiopiaEuro areaEurope & Central AsiaEurope & Central Asia (excluding high income)Europe & Central Asia (IDA & IBRD countries)European UnionFaroe IslandsFijiFinlandFragile and conflict affected situationsFranceFrench PolynesiaGabonGambia, TheGeorgiaGermanyGhanaGreeceGreenlandGrenadaGuatemalaGuineaGuinea-BissauGuyanaHaitiHeavily indebted poor countries (HIPC)High incomeHondurasHong Kong SAR, ChinaHungaryIBRD onlyIcelandIDA & IBRD totalIDA blendIDA onlyIDA totalIndiaIndonesiaIran, Islamic Rep.IraqIrelandIsraelItalyJamaicaJapanJordanKazakhstanKenyaKiribatiKorea, Rep.KuwaitKyrgyz RepublicLao PDRLate-demographic dividendLatin America & Caribbean Latin America & Caribbean (excluding high income)Latin America & the Caribbean (IDA & IBRD countries)LatviaLeast developed countries: UN classificationLebanonLesothoLiberiaLibyaLithuaniaLow & middle incomeLower middle incomeLuxembourgMacao SAR, ChinaMacedonia, FYRMadagascarMalawiMalaysiaMaldivesMaliMaltaMauritaniaMauritiusMexicoMiddle East & North AfricaMiddle East & North Africa (excluding high income)Middle East & North Africa (IDA & IBRD countries)Middle incomeMoldovaMongoliaMoroccoMozambiqueMyanmarNamibiaNepalNetherlandsNew CaledoniaNew ZealandNicaraguaNigerNigeriaNorth AmericaNorwayOECD membersOmanOther small statesPacific island small statesPakistanPalauPanamaPapua New GuineaParaguayPeruPhilippinesPolandPortugalPost-demographic dividendPre-demographic dividendQatarRomaniaRussian FederationRwandaSamoaSao Tome and PrincipeSaudi ArabiaSenegalSerbiaSeychellesSierra LeoneSingaporeSlovak RepublicSloveniaSmall statesSolomon IslandsSomaliaSouth AfricaSouth AsiaSouth Asia (IDA & IBRD)SpainSri LankaSt. Kitts and NevisSt. LuciaSt. Vincent and the GrenadinesSub-Saharan Africa Sub-Saharan Africa (excluding high income)Sub-Saharan Africa (IDA & IBRD countries)SudanSurinameSwazilandSwedenSwitzerlandSyrian Arab RepublicTajikistanTanzaniaThailandTimor-LesteTogoTongaTrinidad and TobagoTunisiaTurkeyTurkmenistanTurks and Caicos IslandsTuvaluUgandaUkraineUnited Arab EmiratesUnited KingdomUnited StatesUpper middle incomeUruguayVanuatuVenezuela, RBVietnamVirgin Islands (U.S.)WorldYemen, Rep.ZambiaZimbabwe Timeline:
This timeline shows a graph from 1963 to 2015 of Congo, Rep.. No data until 1962. Number of actual observations by date: 33.
Source name:
World Development Indicators
Source organization:
World Bank staff estimates from the Comtrade database maintained by the United Nations Statistics Division.
Categories, topics:
Private Sector, Trade
Last updated:
apr 23, 2017
Indicators value changes by year
Maximum:
51.729
jan 1, 1964
At the date of observation
Value
Absolute change
Change from previous value
jan 1, 1963
39.662
+39.662
0.0%
jan 1, 1964
51.729
+12.066
30.42%
jan 1, 1965
47.974
-3.755
-7.26%
jan 1, 1966
50.875
+2.901
6.05%
jan 1, 1967
43.875
-7.0
-13.76%
jan 1, 1968
41.635
-2.24
-5.1%
jan 1, 1969
45.079
+3.443
8.27%
jan 1, 1971
29.039
-16.039
-35.58%
jan 1, 1972
34.268
+5.229
18.01%
jan 1, 1973
38.69
+4.421
12.9%
jan 1, 1974
31.953
-6.736
-17.41%
jan 1, 1975
7.995
-23.958
-74.98%
jan 1, 1976
11.612
+3.617
45.24%
jan 1, 1977
12.978
+1.366
11.76%
jan 1, 1978
15.892
+2.914
22.45%
jan 1, 1979
21.473
+5.581
35.12%
jan 1, 1980
7.623
-13.849
-64.5%
jan 1, 1981
6.67
-0.953
-12.51%
jan 1, 1984
8.977
+2.307
34.59%
jan 1, 1985
3.59
-5.387
-60.01%
jan 1, 1986
3.5
-0.09
-2.5%
jan 1, 1987
2.454
-1.046
-29.88%
jan 1, 1994
2.457
+0.003
0.11%
jan 1, 1995
2.145
-0.312
-12.7%
jan 1, 1996
2.71
+0.565
26.33%
jan 1, 2008
9.68
+6.971
257.27%
jan 1, 2009
13.582
+3.902
40.31%
jan 1, 2010
27.49
+13.908
102.4%
jan 1, 2011
30.477
+2.988
10.87%
jan 1, 2012
21.509
-8.968
-29.43%
jan 1, 2013
20.101
-1.409
-6.55%
jan 1, 2014
23.202
+3.102
15.43%
jan 1, 2015
36.763
+13.561
58.45%
Ranking of countries by current statistics by years


Comments: