29
/
en
AIzaSyAYiBZKx7MnpbEhh9jyipgxe19OcubqV5w
April 1, 2024
221102
Paraguay
PRY
true
2
1
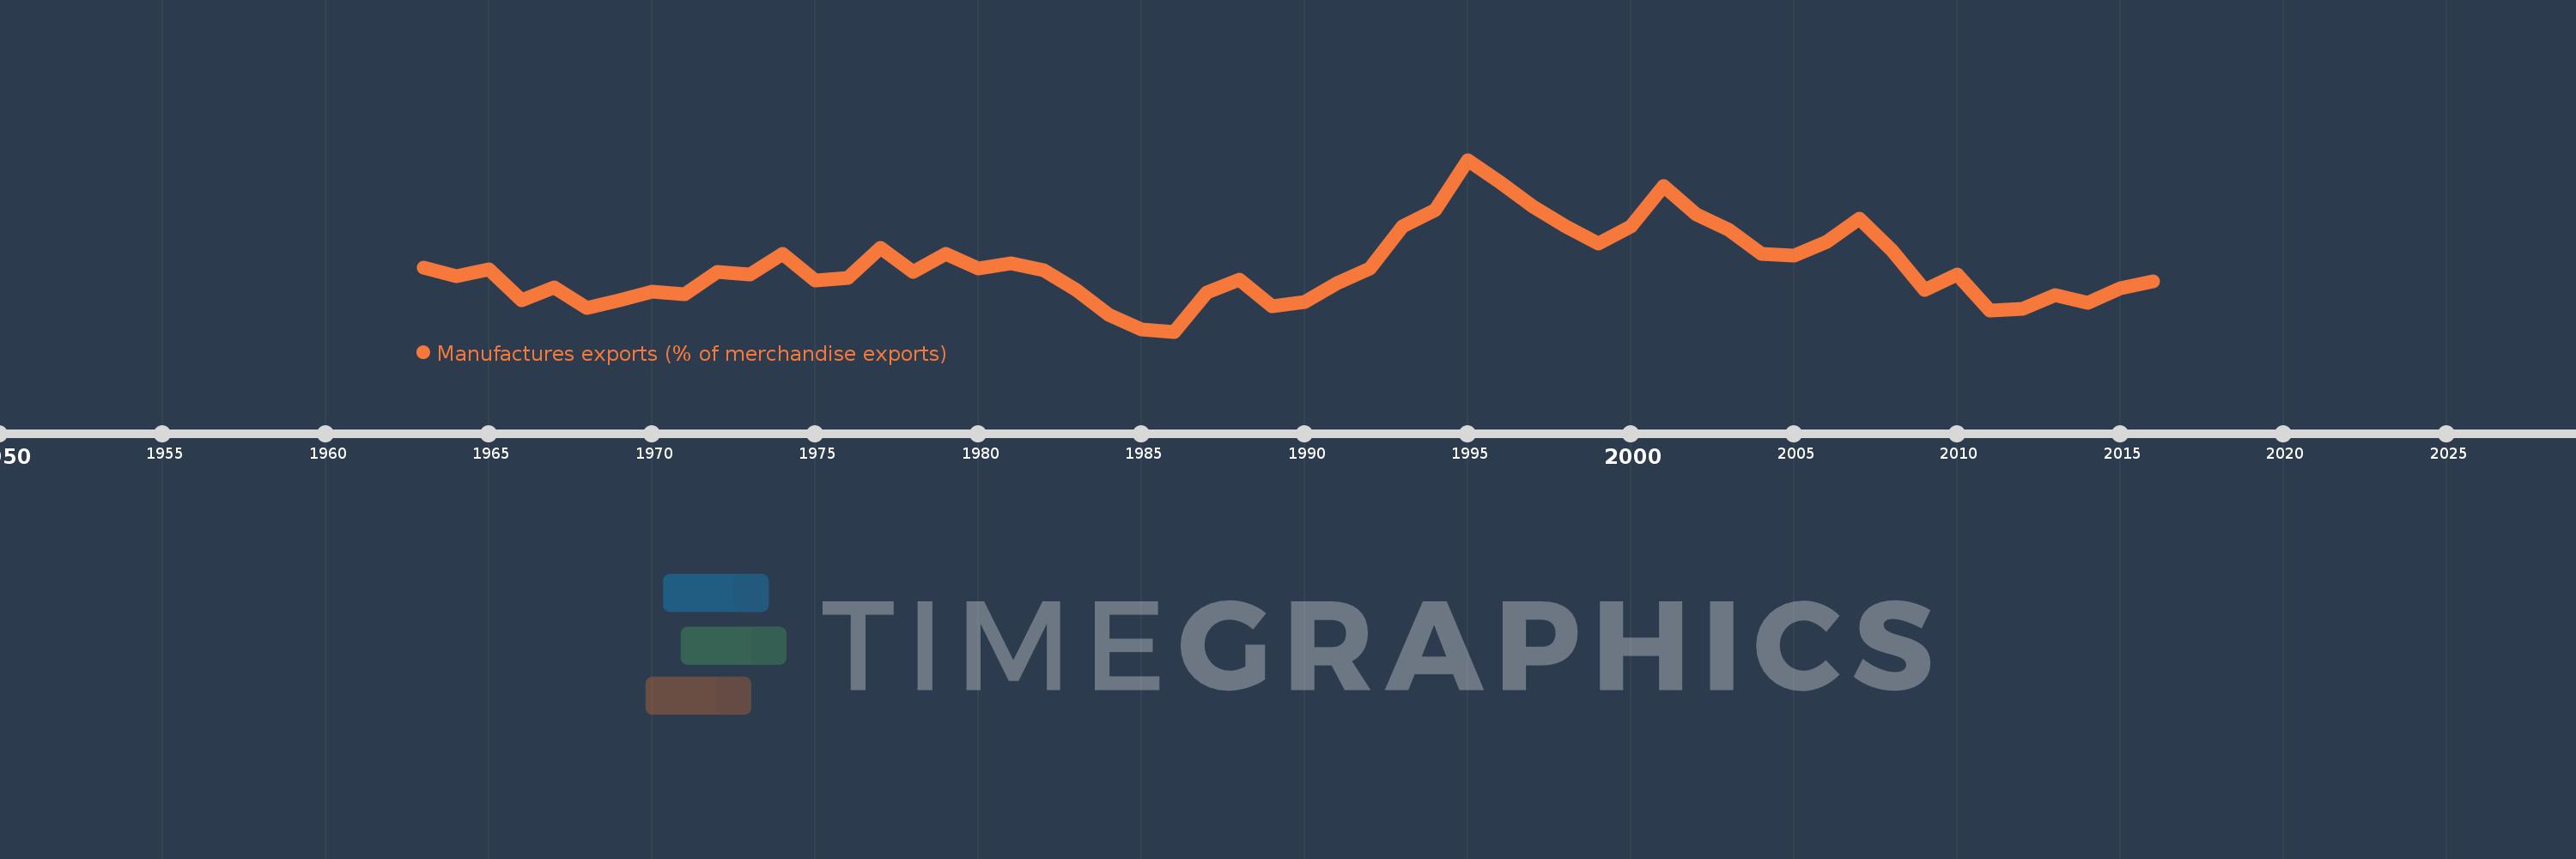
Manufactures exports (% of merchandise exports)
2016,2015,2014,2013,2012,2011,2010,2009,2008,2007,2006,2005,2004,2003,2002,2001,2000,1999,1998,1997,1996,1995,1994,1993,1992,1991,1990,1989,1988,1987,1986,1985,1984,1983,1982,1981,1980,1979,1978,1977,1976,1975,1974,1973,1972,1971,1970,1969,1968,1967,1966,1965,1964,1963
This statistics in other country:
AfghanistanAlbaniaAlgeriaAndorraAngolaAntigua and BarbudaArab WorldArgentinaArmeniaArubaAustraliaAustriaAzerbaijanBahamas, TheBahrainBangladeshBarbadosBelarusBelgiumBelizeBeninBermudaBhutanBoliviaBosnia and HerzegovinaBotswanaBrazilBrunei DarussalamBulgariaBurkina FasoBurundiCabo VerdeCambodiaCameroonCanadaCaribbean small statesCayman IslandsCentral African RepublicCentral Europe and the BalticsChadChileChinaColombiaComorosCongo, Dem. Rep.Congo, Rep.Costa RicaCote d'IvoireCroatiaCubaCyprusCzech RepublicDenmarkDjiboutiDominicaDominican RepublicEarly-demographic dividendEast Asia & PacificEast Asia & Pacific (excluding high income)East Asia & Pacific (IDA & IBRD countries)EcuadorEgypt, Arab Rep.El SalvadorEquatorial GuineaEritreaEstoniaEthiopiaEuro areaEurope & Central AsiaEurope & Central Asia (excluding high income)Europe & Central Asia (IDA & IBRD countries)European UnionFaroe IslandsFijiFinlandFragile and conflict affected situationsFranceFrench PolynesiaGabonGambia, TheGeorgiaGermanyGhanaGreeceGreenlandGrenadaGuatemalaGuineaGuinea-BissauGuyanaHaitiHeavily indebted poor countries (HIPC)High incomeHondurasHong Kong SAR, ChinaHungaryIBRD onlyIcelandIDA & IBRD totalIDA blendIDA onlyIDA totalIndiaIndonesiaIran, Islamic Rep.IraqIrelandIsraelItalyJamaicaJapanJordanKazakhstanKenyaKiribatiKorea, Rep.KuwaitKyrgyz RepublicLao PDRLate-demographic dividendLatin America & Caribbean Latin America & Caribbean (excluding high income)Latin America & the Caribbean (IDA & IBRD countries)LatviaLeast developed countries: UN classificationLebanonLesothoLiberiaLibyaLithuaniaLow & middle incomeLower middle incomeLuxembourgMacao SAR, ChinaMacedonia, FYRMadagascarMalawiMalaysiaMaldivesMaliMaltaMauritaniaMauritiusMexicoMiddle East & North AfricaMiddle East & North Africa (excluding high income)Middle East & North Africa (IDA & IBRD countries)Middle incomeMoldovaMongoliaMoroccoMozambiqueMyanmarNamibiaNepalNetherlandsNew CaledoniaNew ZealandNicaraguaNigerNigeriaNorth AmericaNorwayOECD membersOmanOther small statesPacific island small statesPakistanPalauPanamaPapua New GuineaParaguayPeruPhilippinesPolandPortugalPost-demographic dividendPre-demographic dividendQatarRomaniaRussian FederationRwandaSamoaSao Tome and PrincipeSaudi ArabiaSenegalSerbiaSeychellesSierra LeoneSingaporeSlovak RepublicSloveniaSmall statesSolomon IslandsSomaliaSouth AfricaSouth AsiaSouth Asia (IDA & IBRD)SpainSri LankaSt. Kitts and NevisSt. LuciaSt. Vincent and the GrenadinesSub-Saharan Africa Sub-Saharan Africa (excluding high income)Sub-Saharan Africa (IDA & IBRD countries)SudanSurinameSwazilandSwedenSwitzerlandSyrian Arab RepublicTajikistanTanzaniaThailandTimor-LesteTogoTongaTrinidad and TobagoTunisiaTurkeyTurkmenistanTurks and Caicos IslandsTuvaluUgandaUkraineUnited Arab EmiratesUnited KingdomUnited StatesUpper middle incomeUruguayVanuatuVenezuela, RBVietnamVirgin Islands (U.S.)WorldYemen, Rep.ZambiaZimbabwe Timeline:
This timeline shows a graph from 1963 to 2016 of Paraguay. No data until 1962. Number of actual observations by date: 54.
Source name:
World Development Indicators
Source organization:
World Bank staff estimates from the Comtrade database maintained by the United Nations Statistics Division.
Categories, topics:
Private Sector, Trade
Last updated:
apr 23, 2017
Indicators value changes by year
At the date of observation
Value
Absolute change
Change from previous value
jan 1, 1963
11.389
+11.389
0.0%
jan 1, 1964
10.554
-0.835
-7.33%
jan 1, 1965
11.261
+0.706
6.69%
jan 1, 1966
8.381
-2.879
-25.57%
jan 1, 1967
9.6
+1.219
14.54%
jan 1, 1968
7.651
-1.949
-20.3%
jan 1, 1969
8.384
+0.733
9.58%
jan 1, 1970
9.204
+0.82
9.78%
jan 1, 1971
8.952
-0.253
-2.75%
jan 1, 1972
11.014
+2.062
23.04%
jan 1, 1973
10.753
-0.261
-2.37%
jan 1, 1974
12.663
+1.911
17.77%
jan 1, 1975
10.222
-2.441
-19.28%
jan 1, 1976
10.445
+0.224
2.19%
jan 1, 1977
13.209
+2.763
26.45%
jan 1, 1978
10.968
-2.241
-16.97%
jan 1, 1979
12.657
+1.69
15.41%
jan 1, 1980
11.3
-1.357
-10.72%
jan 1, 1981
11.775
+0.475
4.2%
jan 1, 1982
11.111
-0.664
-5.64%
jan 1, 1983
9.325
-1.786
-16.07%
jan 1, 1984
7.013
-2.312
-24.79%
jan 1, 1985
5.676
-1.337
-19.06%
jan 1, 1986
5.483
-0.193
-3.4%
jan 1, 1987
9.063
+3.58
65.29%
jan 1, 1988
10.261
+1.198
13.22%
jan 1, 1989
7.836
-2.425
-23.63%
jan 1, 1990
8.224
+0.387
4.94%
jan 1, 1991
9.927
+1.704
20.72%
jan 1, 1992
11.285
+1.358
13.68%
jan 1, 1993
15.207
+3.922
34.75%
jan 1, 1994
16.686
+1.478
9.72%
jan 1, 1995
21.32
+4.635
27.78%
jan 1, 1996
19.256
-2.064
-9.68%
jan 1, 1997
16.98
-2.277
-11.82%
jan 1, 1998
15.168
-1.811
-10.67%
jan 1, 1999
13.574
-1.595
-10.51%
jan 1, 2000
15.22
+1.647
12.13%
jan 1, 2001
18.877
+3.657
24.03%
jan 1, 2002
16.313
-2.564
-13.58%
jan 1, 2003
14.841
-1.471
-9.02%
jan 1, 2004
12.684
-2.157
-14.54%
jan 1, 2005
12.509
-0.174
-1.37%
jan 1, 2006
13.757
+1.248
9.98%
jan 1, 2007
15.87
+2.112
15.35%
jan 1, 2008
12.986
-2.884
-18.17%
jan 1, 2009
9.287
-3.698
-28.48%
jan 1, 2010
10.73
+1.443
15.53%
jan 1, 2011
7.439
-3.292
-30.68%
jan 1, 2012
7.616
+0.178
2.39%
jan 1, 2013
8.833
+1.217
15.98%
jan 1, 2014
8.139
-0.694
-7.86%
jan 1, 2015
9.493
+1.355
16.64%
jan 1, 2016
10.084
+0.591
6.22%
Ranking of countries by current statistics by years


Comments: