29
/
en
AIzaSyAYiBZKx7MnpbEhh9jyipgxe19OcubqV5w
April 1, 2024
62772
World
WLD
false
2
1
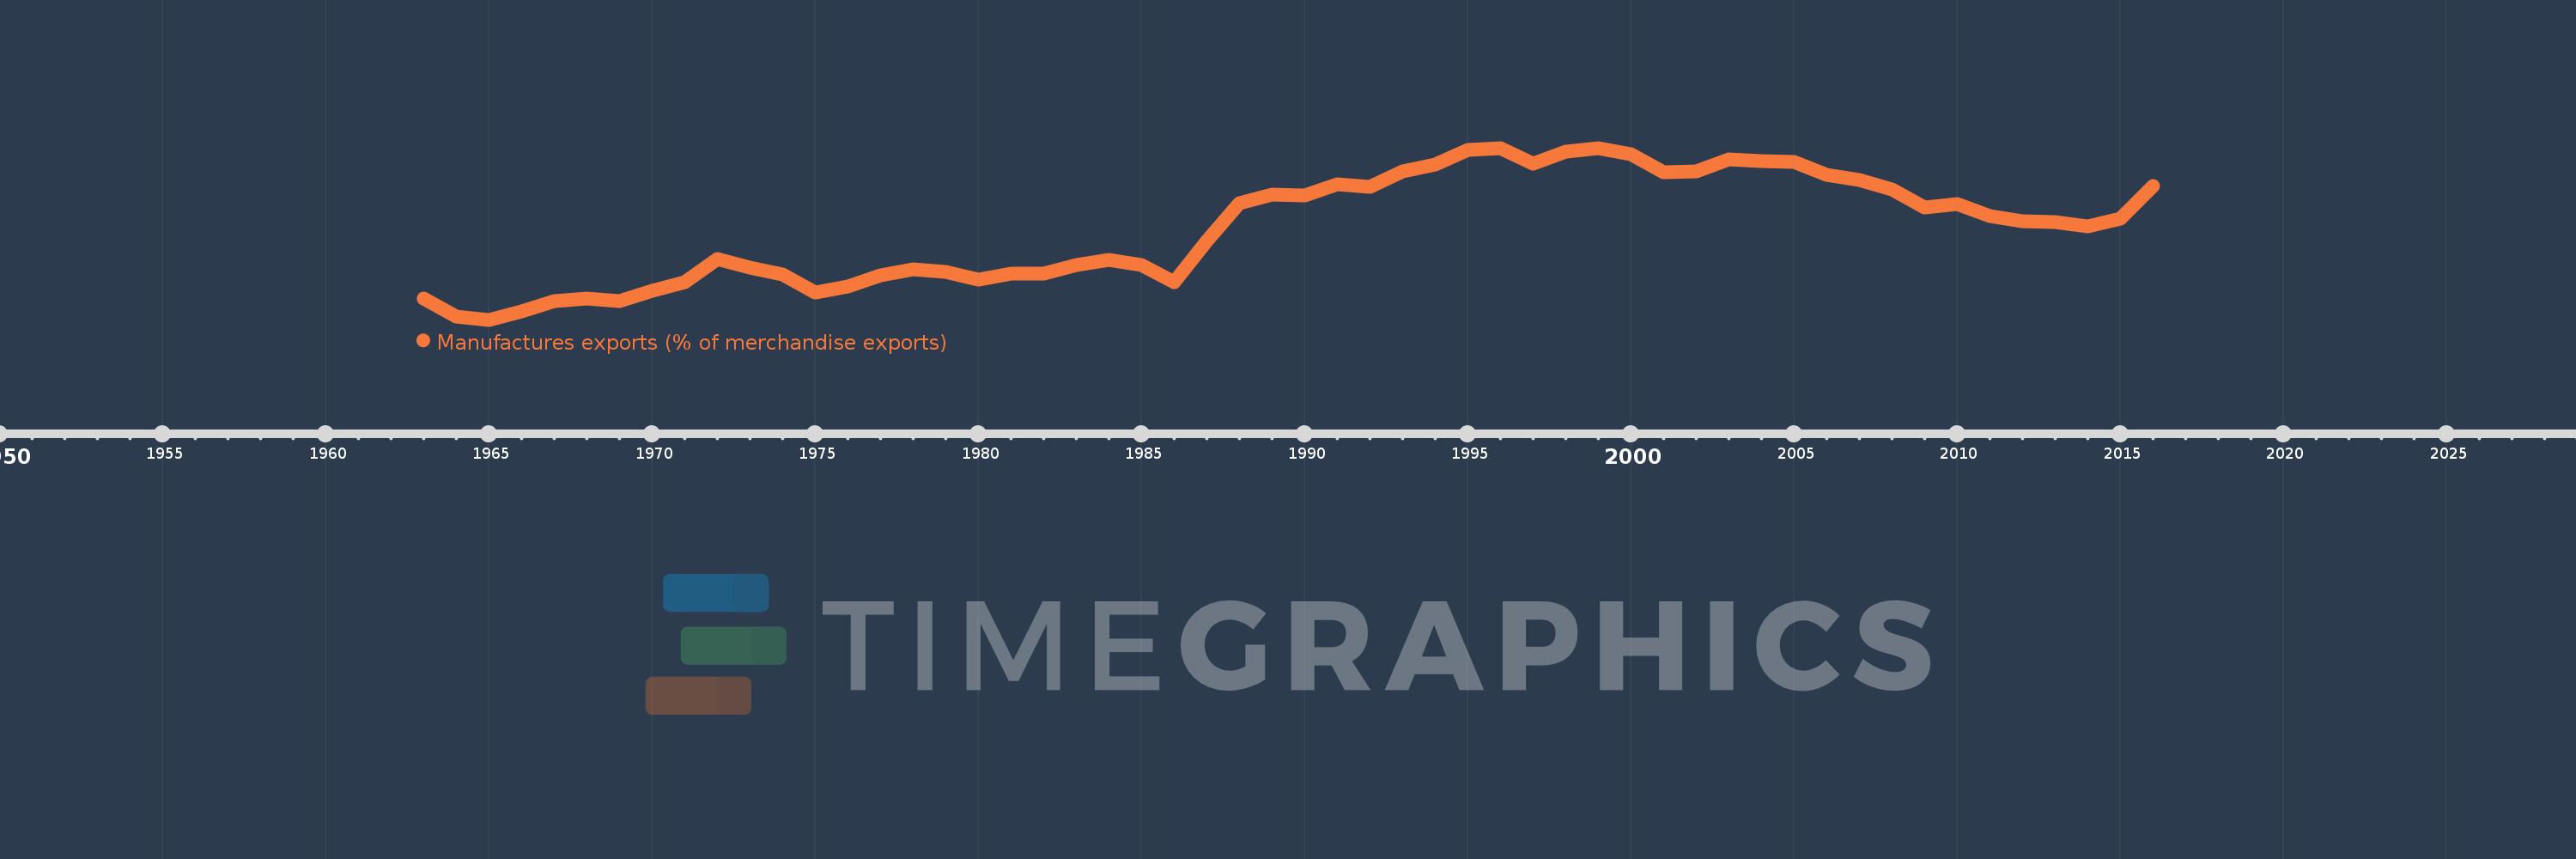
Manufactures exports (% of merchandise exports)
2016,2015,2014,2013,2012,2011,2010,2009,2008,2007,2006,2005,2004,2003,2002,2001,2000,1999,1998,1997,1996,1995,1994,1993,1992,1991,1990,1989,1988,1987,1986,1985,1984,1983,1982,1981,1980,1979,1978,1977,1976,1975,1974,1973,1972,1971,1970,1969,1968,1967,1966,1965,1964,1963
This statistics in other country:
AfghanistanAlbaniaAlgeriaAndorraAngolaAntigua and BarbudaArab WorldArgentinaArmeniaArubaAustraliaAustriaAzerbaijanBahamas, TheBahrainBangladeshBarbadosBelarusBelgiumBelizeBeninBermudaBhutanBoliviaBosnia and HerzegovinaBotswanaBrazilBrunei DarussalamBulgariaBurkina FasoBurundiCabo VerdeCambodiaCameroonCanadaCaribbean small statesCayman IslandsCentral African RepublicCentral Europe and the BalticsChadChileChinaColombiaComorosCongo, Dem. Rep.Congo, Rep.Costa RicaCote d'IvoireCroatiaCubaCyprusCzech RepublicDenmarkDjiboutiDominicaDominican RepublicEarly-demographic dividendEast Asia & PacificEast Asia & Pacific (excluding high income)East Asia & Pacific (IDA & IBRD countries)EcuadorEgypt, Arab Rep.El SalvadorEquatorial GuineaEritreaEstoniaEthiopiaEuro areaEurope & Central AsiaEurope & Central Asia (excluding high income)Europe & Central Asia (IDA & IBRD countries)European UnionFaroe IslandsFijiFinlandFragile and conflict affected situationsFranceFrench PolynesiaGabonGambia, TheGeorgiaGermanyGhanaGreeceGreenlandGrenadaGuatemalaGuineaGuinea-BissauGuyanaHaitiHeavily indebted poor countries (HIPC)High incomeHondurasHong Kong SAR, ChinaHungaryIBRD onlyIcelandIDA & IBRD totalIDA blendIDA onlyIDA totalIndiaIndonesiaIran, Islamic Rep.IraqIrelandIsraelItalyJamaicaJapanJordanKazakhstanKenyaKiribatiKorea, Rep.KuwaitKyrgyz RepublicLao PDRLate-demographic dividendLatin America & Caribbean Latin America & Caribbean (excluding high income)Latin America & the Caribbean (IDA & IBRD countries)LatviaLeast developed countries: UN classificationLebanonLesothoLiberiaLibyaLithuaniaLow & middle incomeLower middle incomeLuxembourgMacao SAR, ChinaMacedonia, FYRMadagascarMalawiMalaysiaMaldivesMaliMaltaMauritaniaMauritiusMexicoMiddle East & North AfricaMiddle East & North Africa (excluding high income)Middle East & North Africa (IDA & IBRD countries)Middle incomeMoldovaMongoliaMoroccoMozambiqueMyanmarNamibiaNepalNetherlandsNew CaledoniaNew ZealandNicaraguaNigerNigeriaNorth AmericaNorwayOECD membersOmanOther small statesPacific island small statesPakistanPalauPanamaPapua New GuineaParaguayPeruPhilippinesPolandPortugalPost-demographic dividendPre-demographic dividendQatarRomaniaRussian FederationRwandaSamoaSao Tome and PrincipeSaudi ArabiaSenegalSerbiaSeychellesSierra LeoneSingaporeSlovak RepublicSloveniaSmall statesSolomon IslandsSomaliaSouth AfricaSouth AsiaSouth Asia (IDA & IBRD)SpainSri LankaSt. Kitts and NevisSt. LuciaSt. Vincent and the GrenadinesSub-Saharan Africa Sub-Saharan Africa (excluding high income)Sub-Saharan Africa (IDA & IBRD countries)SudanSurinameSwazilandSwedenSwitzerlandSyrian Arab RepublicTajikistanTanzaniaThailandTimor-LesteTogoTongaTrinidad and TobagoTunisiaTurkeyTurkmenistanTurks and Caicos IslandsTuvaluUgandaUkraineUnited Arab EmiratesUnited KingdomUnited StatesUpper middle incomeUruguayVanuatuVenezuela, RBVietnamVirgin Islands (U.S.)WorldYemen, Rep.ZambiaZimbabwe Timeline:
This timeline shows a graph from 1963 to 2016 of World. No data until 1962. Number of actual observations by date: 54.
Source name:
World Development Indicators
Source organization:
World Bank staff estimates from the Comtrade database maintained by the United Nations Statistics Division.
Categories, topics:
Private Sector, Trade
Last updated:
apr 23, 2017
Indicators value changes by year
Minimum:
54.671
jan 1, 1965
Maximum:
73.986
jan 1, 1996
At the date of observation
Value
Absolute change
Change from previous value
jan 1, 1963
57.055
+57.055
0.0%
jan 1, 1964
55.007
-2.048
-3.59%
jan 1, 1965
54.671
-0.336
-0.61%
jan 1, 1966
55.611
+0.94
1.72%
jan 1, 1967
56.76
+1.149
2.07%
jan 1, 1968
57.036
+0.276
0.49%
jan 1, 1969
56.795
-0.241
-0.42%
jan 1, 1970
57.943
+1.148
2.02%
jan 1, 1971
58.903
+0.96
1.66%
jan 1, 1972
61.451
+2.548
4.33%
jan 1, 1973
60.568
-0.883
-1.44%
jan 1, 1974
59.774
-0.794
-1.31%
jan 1, 1975
57.711
-2.063
-3.45%
jan 1, 1976
58.455
+0.743
1.29%
jan 1, 1977
59.711
+1.257
2.15%
jan 1, 1978
60.35
+0.638
1.07%
jan 1, 1979
60.082
-0.268
-0.44%
jan 1, 1980
59.139
-0.943
-1.57%
jan 1, 1981
59.904
+0.766
1.29%
jan 1, 1982
59.841
-0.064
-0.11%
jan 1, 1983
60.87
+1.029
1.72%
jan 1, 1984
61.399
+0.529
0.87%
jan 1, 1985
60.86
-0.539
-0.88%
jan 1, 1986
58.927
-1.933
-3.18%
jan 1, 1987
63.549
+4.622
7.84%
jan 1, 1988
67.799
+4.25
6.69%
jan 1, 1989
68.734
+0.935
1.38%
jan 1, 1990
68.625
-0.109
-0.16%
jan 1, 1991
69.943
+1.318
1.92%
jan 1, 1992
69.59
-0.353
-0.5%
jan 1, 1993
71.364
+1.773
2.55%
jan 1, 1994
72.123
+0.76
1.06%
jan 1, 1995
73.725
+1.601
2.22%
jan 1, 1996
73.986
+0.261
0.35%
jan 1, 1997
72.181
-1.804
-2.44%
jan 1, 1998
73.559
+1.377
1.91%
jan 1, 1999
73.925
+0.366
0.5%
jan 1, 2000
73.293
-0.632
-0.86%
jan 1, 2001
71.252
-2.041
-2.79%
jan 1, 2002
71.305
+0.054
0.08%
jan 1, 2003
72.731
+1.426
2.0%
jan 1, 2004
72.535
-0.195
-0.27%
jan 1, 2005
72.403
-0.133
-0.18%
jan 1, 2006
71.007
-1.396
-1.93%
jan 1, 2007
70.424
-0.583
-0.82%
jan 1, 2008
69.319
-1.105
-1.57%
jan 1, 2009
67.254
-2.065
-2.98%
jan 1, 2010
67.633
+0.379
0.56%
jan 1, 2011
66.282
-1.35
-2.0%
jan 1, 2012
65.723
-0.559
-0.84%
jan 1, 2013
65.644
-0.079
-0.12%
jan 1, 2014
65.192
-0.452
-0.69%
jan 1, 2015
66.083
+0.891
1.37%
jan 1, 2016
69.728
+3.645
5.52%
Ranking of countries by current statistics by years


Comments: