29
/
en
AIzaSyAYiBZKx7MnpbEhh9jyipgxe19OcubqV5w
April 1, 2024
215503
Oman
OMN
true
2
1
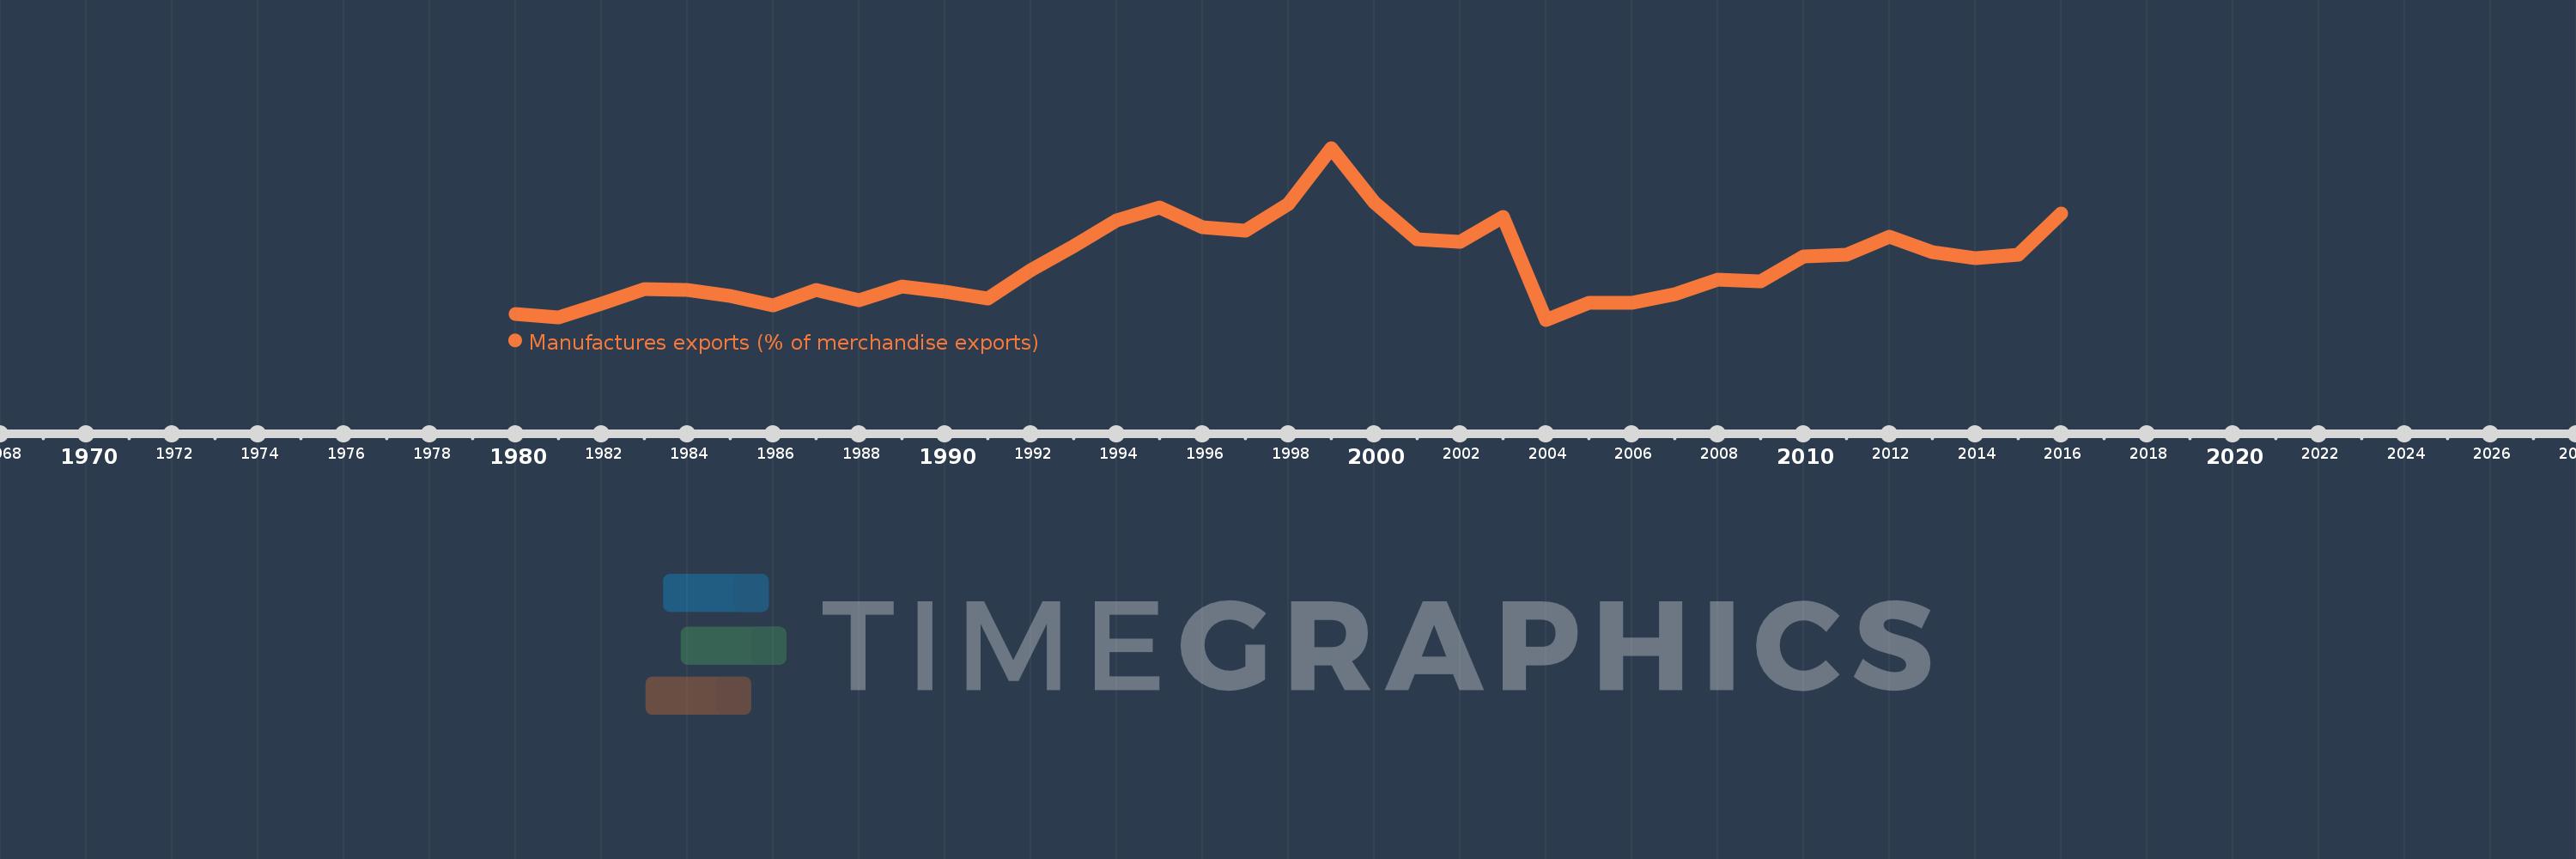
Manufactures exports (% of merchandise exports)
2016,2015,2014,2013,2012,2011,2010,2009,2008,2007,2006,2005,2004,2003,2002,2001,2000,1999,1998,1997,1996,1995,1994,1993,1992,1991,1990,1989,1988,1987,1986,1985,1984,1983,1982,1981,1980
This statistics in other country:
AfghanistanAlbaniaAlgeriaAndorraAngolaAntigua and BarbudaArab WorldArgentinaArmeniaArubaAustraliaAustriaAzerbaijanBahamas, TheBahrainBangladeshBarbadosBelarusBelgiumBelizeBeninBermudaBhutanBoliviaBosnia and HerzegovinaBotswanaBrazilBrunei DarussalamBulgariaBurkina FasoBurundiCabo VerdeCambodiaCameroonCanadaCaribbean small statesCayman IslandsCentral African RepublicCentral Europe and the BalticsChadChileChinaColombiaComorosCongo, Dem. Rep.Congo, Rep.Costa RicaCote d'IvoireCroatiaCubaCyprusCzech RepublicDenmarkDjiboutiDominicaDominican RepublicEarly-demographic dividendEast Asia & PacificEast Asia & Pacific (excluding high income)East Asia & Pacific (IDA & IBRD countries)EcuadorEgypt, Arab Rep.El SalvadorEquatorial GuineaEritreaEstoniaEthiopiaEuro areaEurope & Central AsiaEurope & Central Asia (excluding high income)Europe & Central Asia (IDA & IBRD countries)European UnionFaroe IslandsFijiFinlandFragile and conflict affected situationsFranceFrench PolynesiaGabonGambia, TheGeorgiaGermanyGhanaGreeceGreenlandGrenadaGuatemalaGuineaGuinea-BissauGuyanaHaitiHeavily indebted poor countries (HIPC)High incomeHondurasHong Kong SAR, ChinaHungaryIBRD onlyIcelandIDA & IBRD totalIDA blendIDA onlyIDA totalIndiaIndonesiaIran, Islamic Rep.IraqIrelandIsraelItalyJamaicaJapanJordanKazakhstanKenyaKiribatiKorea, Rep.KuwaitKyrgyz RepublicLao PDRLate-demographic dividendLatin America & Caribbean Latin America & Caribbean (excluding high income)Latin America & the Caribbean (IDA & IBRD countries)LatviaLeast developed countries: UN classificationLebanonLesothoLiberiaLibyaLithuaniaLow & middle incomeLower middle incomeLuxembourgMacao SAR, ChinaMacedonia, FYRMadagascarMalawiMalaysiaMaldivesMaliMaltaMauritaniaMauritiusMexicoMiddle East & North AfricaMiddle East & North Africa (excluding high income)Middle East & North Africa (IDA & IBRD countries)Middle incomeMoldovaMongoliaMoroccoMozambiqueMyanmarNamibiaNepalNetherlandsNew CaledoniaNew ZealandNicaraguaNigerNigeriaNorth AmericaNorwayOECD membersOmanOther small statesPacific island small statesPakistanPalauPanamaPapua New GuineaParaguayPeruPhilippinesPolandPortugalPost-demographic dividendPre-demographic dividendQatarRomaniaRussian FederationRwandaSamoaSao Tome and PrincipeSaudi ArabiaSenegalSerbiaSeychellesSierra LeoneSingaporeSlovak RepublicSloveniaSmall statesSolomon IslandsSomaliaSouth AfricaSouth AsiaSouth Asia (IDA & IBRD)SpainSri LankaSt. Kitts and NevisSt. LuciaSt. Vincent and the GrenadinesSub-Saharan Africa Sub-Saharan Africa (excluding high income)Sub-Saharan Africa (IDA & IBRD countries)SudanSurinameSwazilandSwedenSwitzerlandSyrian Arab RepublicTajikistanTanzaniaThailandTimor-LesteTogoTongaTrinidad and TobagoTunisiaTurkeyTurkmenistanTurks and Caicos IslandsTuvaluUgandaUkraineUnited Arab EmiratesUnited KingdomUnited StatesUpper middle incomeUruguayVanuatuVenezuela, RBVietnamVirgin Islands (U.S.)WorldYemen, Rep.ZambiaZimbabwe Timeline:
This timeline shows a graph from 1980 to 2016 of Oman. No data until 1979. Number of actual observations by date: 37.
Source name:
World Development Indicators
Source organization:
World Bank staff estimates from the Comtrade database maintained by the United Nations Statistics Division.
Categories, topics:
Private Sector, Trade
Last updated:
apr 23, 2017
Indicators value changes by year
Maximum:
23.492
jan 1, 1999
At the date of observation
Value
Absolute change
Change from previous value
jan 1, 1980
3.342
+3.342
0.0%
jan 1, 1981
2.89
-0.453
-13.55%
jan 1, 1982
4.588
+1.699
58.78%
jan 1, 1983
6.35
+1.762
38.4%
jan 1, 1984
6.27
-0.08
-1.26%
jan 1, 1985
5.541
-0.73
-11.63%
jan 1, 1986
4.411
-1.13
-20.39%
jan 1, 1987
6.237
+1.825
41.38%
jan 1, 1988
5.027
-1.21
-19.4%
jan 1, 1989
6.609
+1.582
31.48%
jan 1, 1990
6.044
-0.565
-8.55%
jan 1, 1991
5.155
-0.889
-14.7%
jan 1, 1992
8.667
+3.511
68.11%
jan 1, 1993
11.599
+2.932
33.84%
jan 1, 1994
14.738
+3.139
27.06%
jan 1, 1995
16.233
+1.496
10.15%
jan 1, 1996
13.877
-2.356
-14.52%
jan 1, 1997
13.463
-0.414
-2.98%
jan 1, 1998
16.645
+3.181
23.63%
jan 1, 1999
23.492
+6.847
41.14%
jan 1, 2000
16.878
-6.614
-28.15%
jan 1, 2001
12.416
-4.462
-26.44%
jan 1, 2002
12.115
-0.301
-2.42%
jan 1, 2003
15.127
+3.012
24.86%
jan 1, 2004
2.616
-12.51
-82.7%
jan 1, 2005
4.628
+2.012
76.89%
jan 1, 2006
4.713
+0.085
1.84%
jan 1, 2007
5.697
+0.984
20.87%
jan 1, 2008
7.464
+1.767
31.02%
jan 1, 2009
7.28
-0.184
-2.46%
jan 1, 2010
10.303
+3.023
41.52%
jan 1, 2011
10.487
+0.184
1.79%
jan 1, 2012
12.681
+2.194
20.93%
jan 1, 2013
10.783
-1.898
-14.97%
jan 1, 2014
10.123
-0.66
-6.12%
jan 1, 2015
10.519
+0.396
3.91%
jan 1, 2016
15.508
+4.989
47.43%
Ranking of countries by current statistics by years


Comments: